Fig. 15
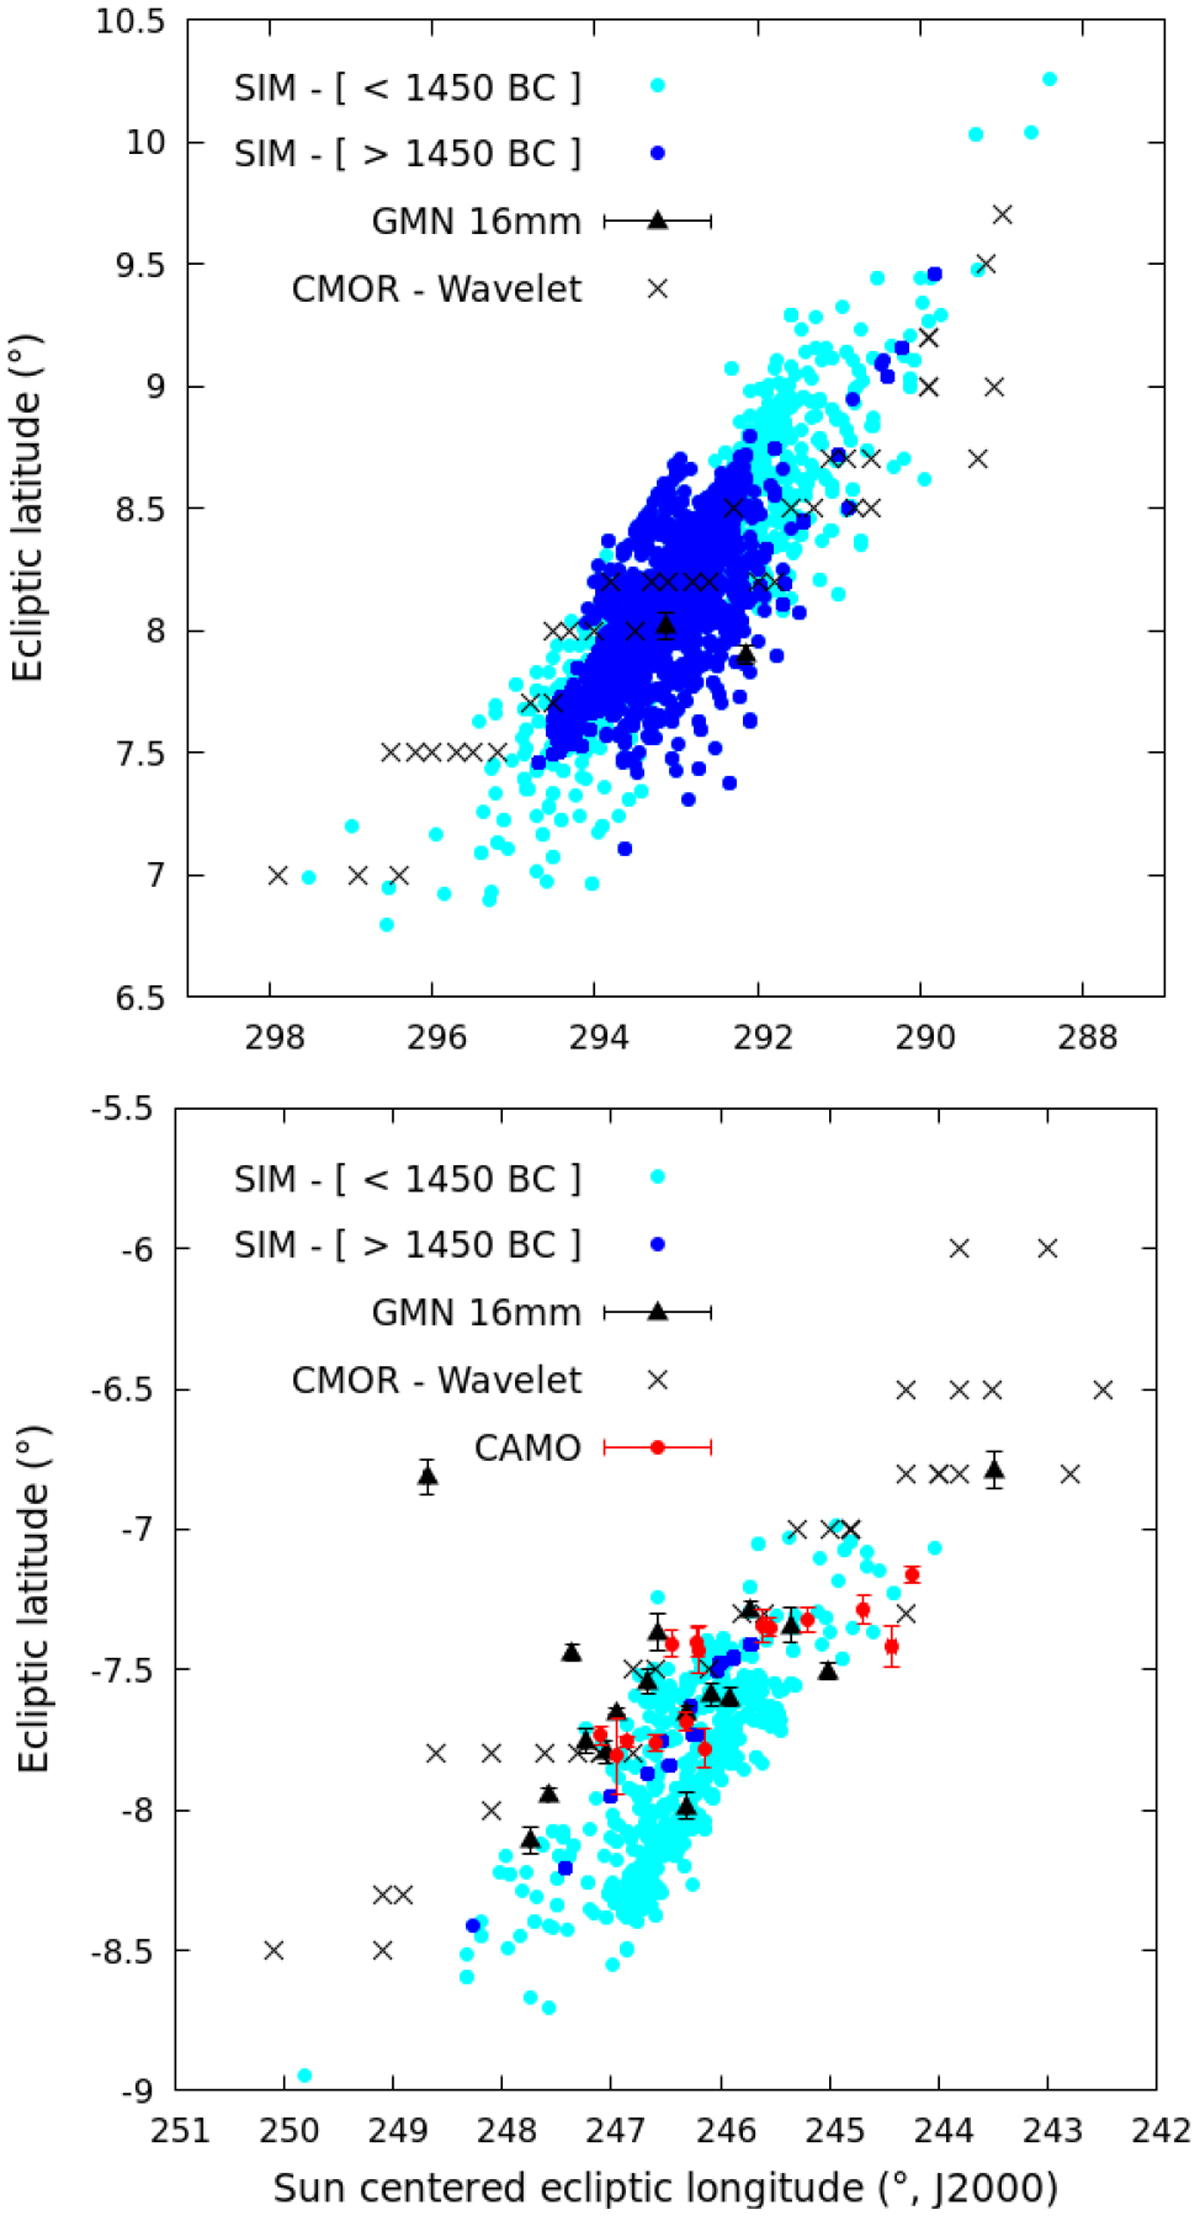
Radiants of the η-Aquariids (top) and Orionids (bottom) measured with CAMO (red circles) and the GMN (black triangles) video networks in 2019. The average shower radiant location in one degree SL bins determined from the wavelet analysis of CMOR data is identified with black crosses. For GMN and CAMO, the formal radiant uncertainty was found using the method of Vida et al. (2019b). Simulated radiants computed for particles ejected before and after 1450 BCE are plotted with cyan and dark blue circles, respectively.
Current usage metrics show cumulative count of Article Views (full-text article views including HTML views, PDF and ePub downloads, according to the available data) and Abstracts Views on Vision4Press platform.
Data correspond to usage on the plateform after 2015. The current usage metrics is available 48-96 hours after online publication and is updated daily on week days.
Initial download of the metrics may take a while.