Fig. 14
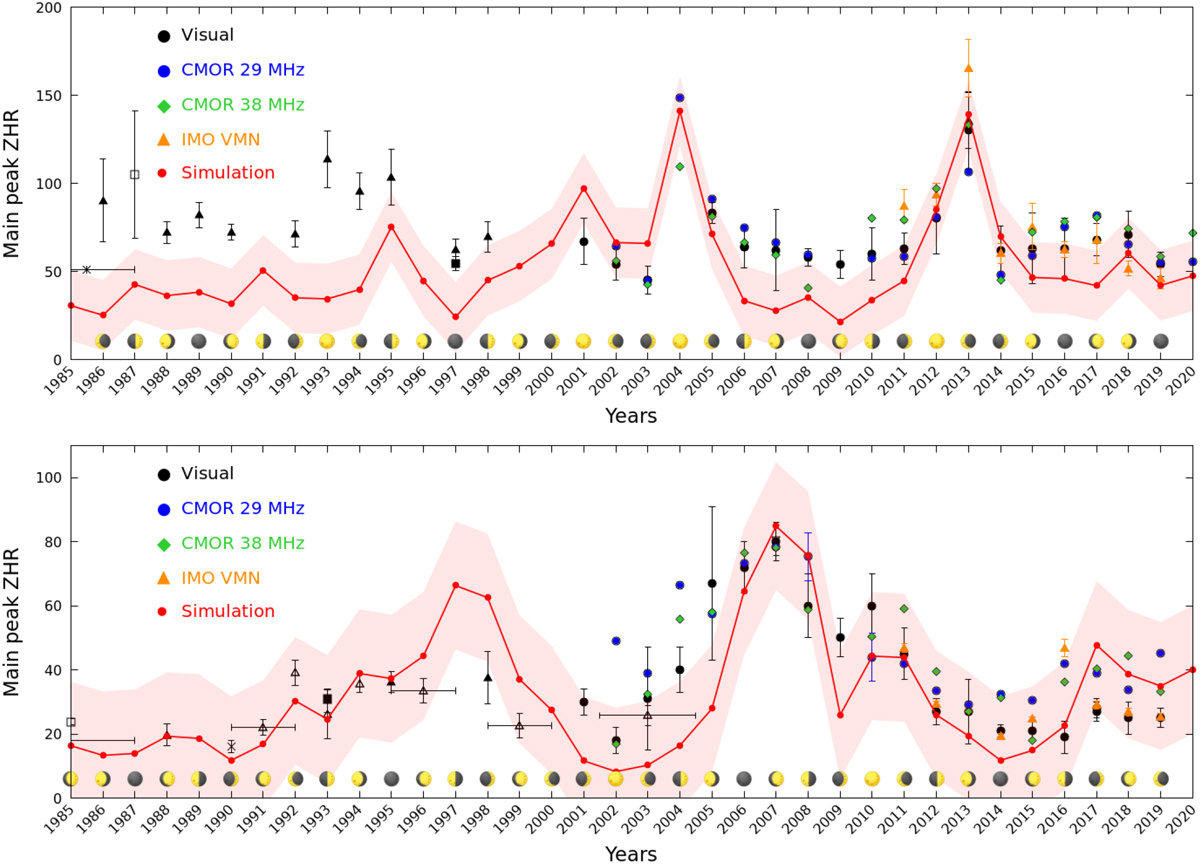
Annual variations of the η-Aquariid (top) and Orionid (bottom) peak ZHRs for the years 1985–2019. The maximum rates recorded by CMOR 29 MHz (blue dots) and 38 MHz (green diamonds) are plotted along with the results of the VMN system (orange triangles) and visual observations (black dots), as in Egal et al. (2020). The envelope of estimated simulated peak variations, with an arbitrary uncertainty of ±20 meteors per hour that allows the framing of most Orionid yearly maximum ZHR rates, are presented in red. The phase of the Moon for each year at the time of the shower peak is also shown, as this significantly affects the quality and quantity of visual and video data.
Current usage metrics show cumulative count of Article Views (full-text article views including HTML views, PDF and ePub downloads, according to the available data) and Abstracts Views on Vision4Press platform.
Data correspond to usage on the plateform after 2015. The current usage metrics is available 48-96 hours after online publication and is updated daily on week days.
Initial download of the metrics may take a while.