Fig. 13
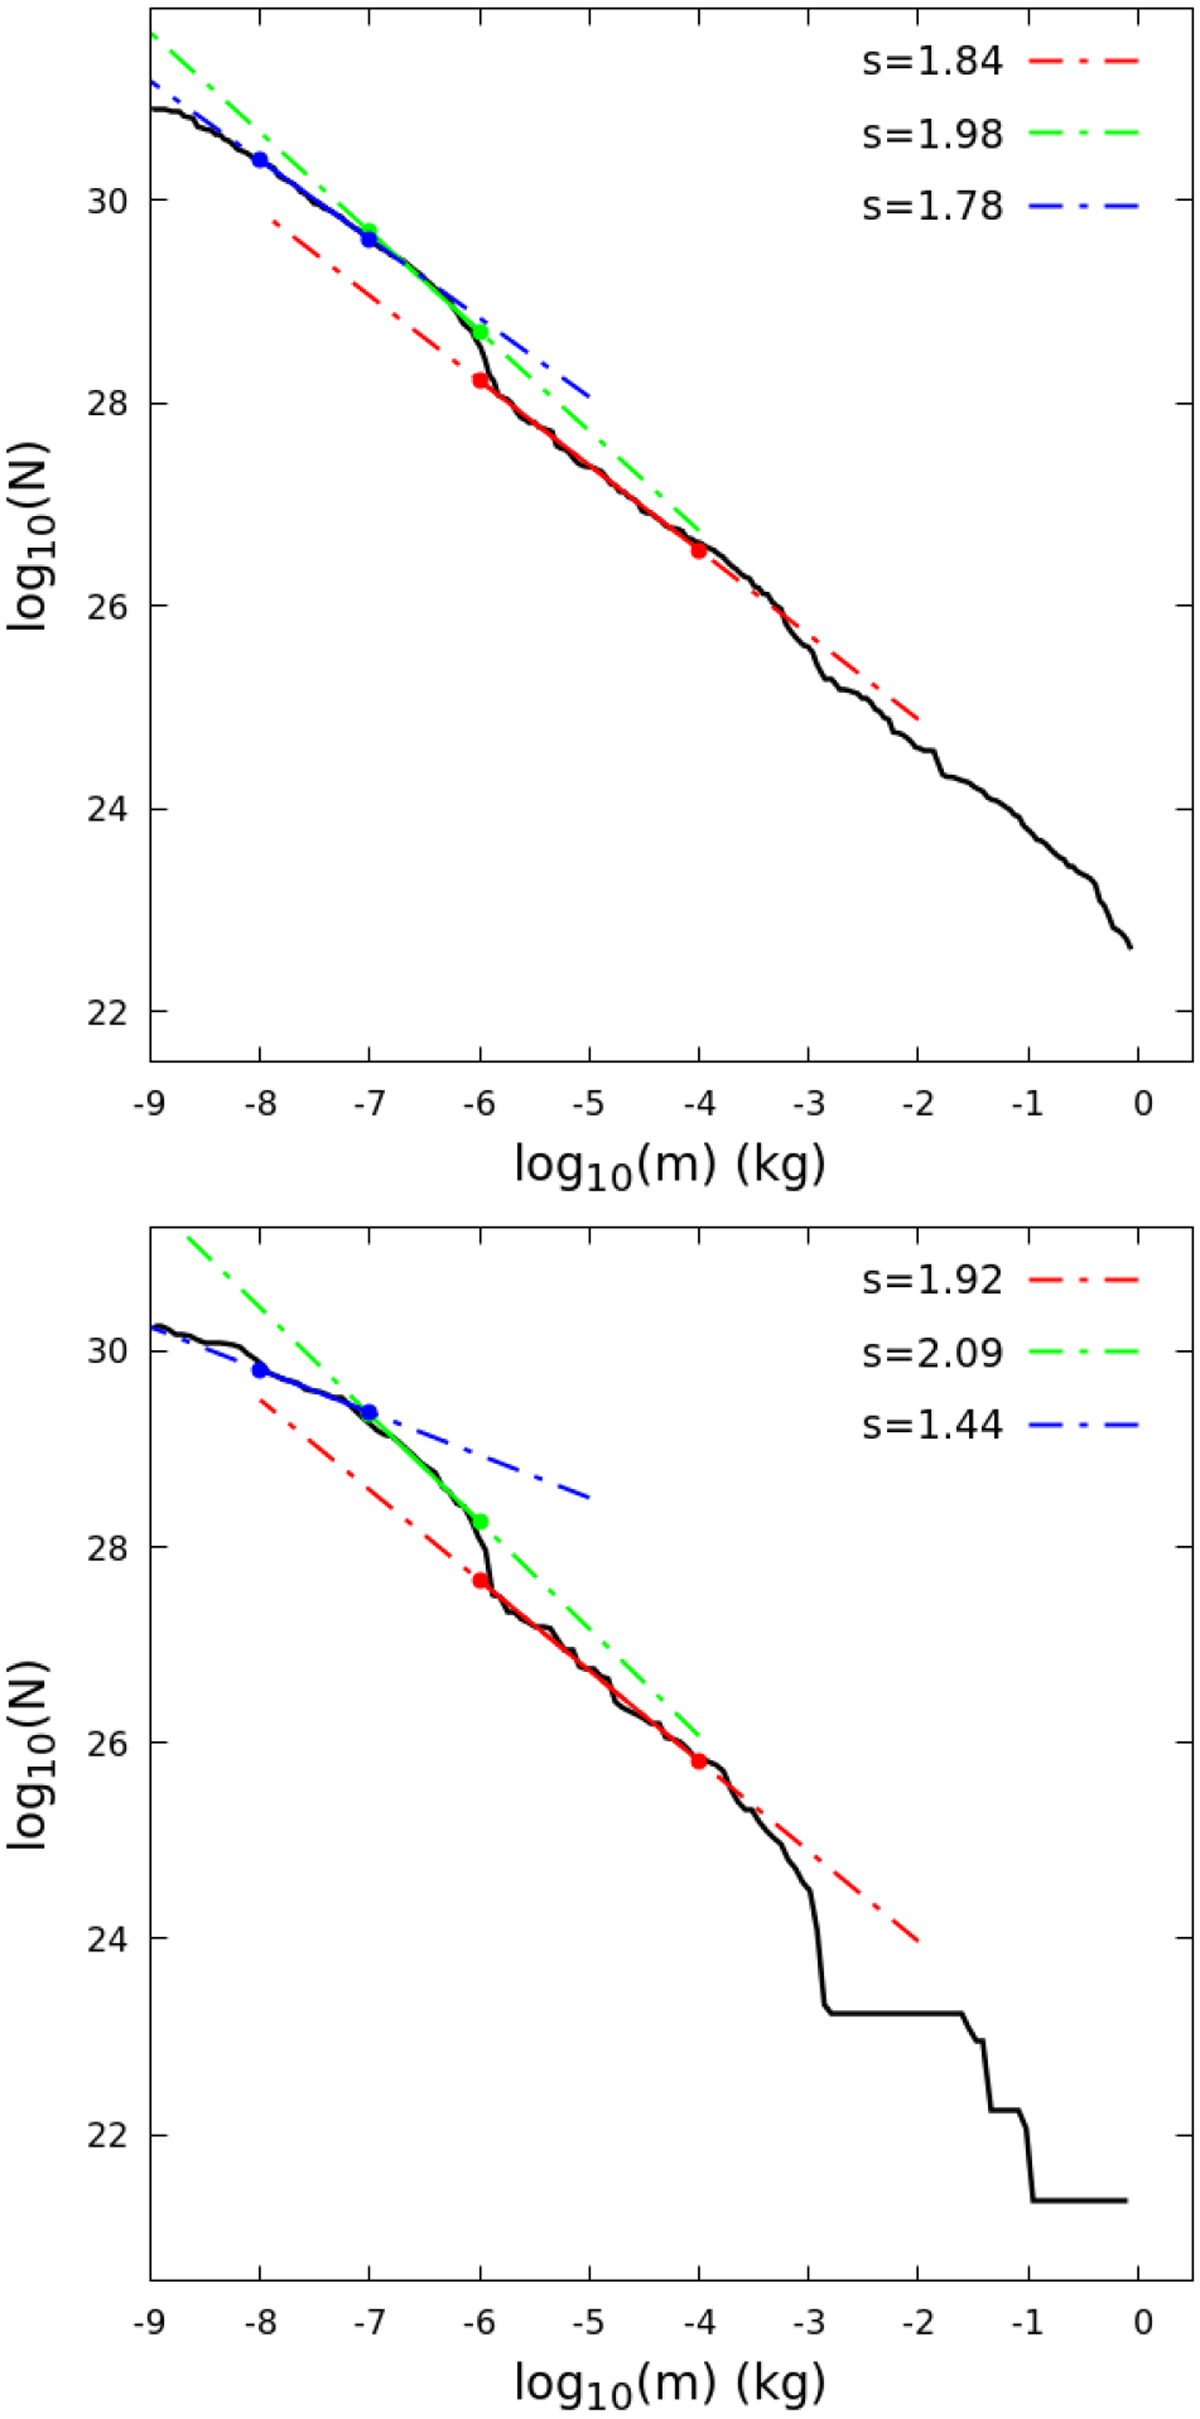
Modeled mass distribution of the η-Aquariids (top) and Orionids (bottom) based on simulated meteoroids encountering the Earth between 2002–2019 near the time of the main peak of activity. The logarithm of the cumulative number of simulated meteors (weighted) is drawn as a function of the logarithm of the particles mass (in kg). Estimates of the differential mass index s in the visual(red), video (green), and radar (blue) mass ranges are provided for comparison. See text for details.
Current usage metrics show cumulative count of Article Views (full-text article views including HTML views, PDF and ePub downloads, according to the available data) and Abstracts Views on Vision4Press platform.
Data correspond to usage on the plateform after 2015. The current usage metrics is available 48-96 hours after online publication and is updated daily on week days.
Initial download of the metrics may take a while.