Fig. 12
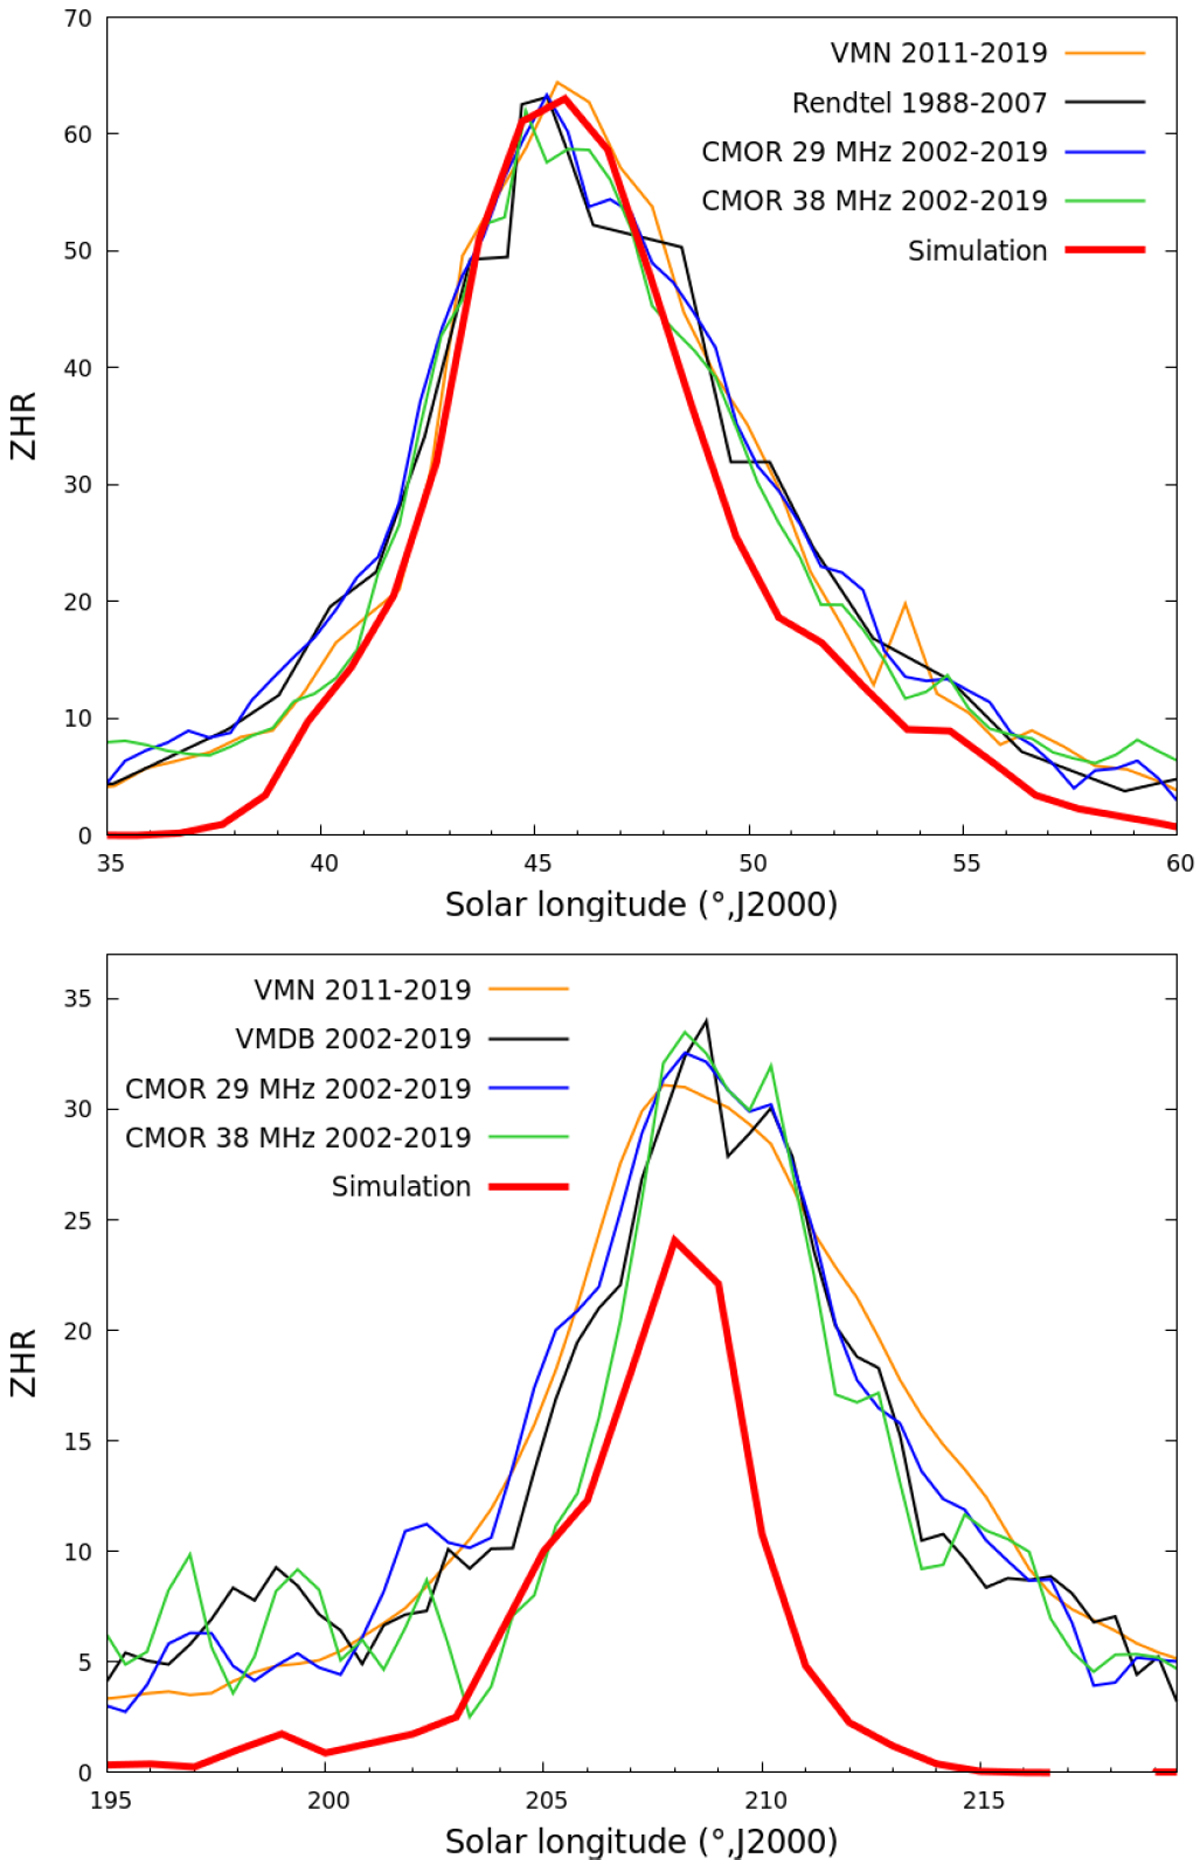
Average activity profile of the η-Aquariid (top) and Orionid (bottom) meteor showers, as measured with the CMOR 29 MHz system (blue) and the 38 MHz system (green) between 2002 and 2019, the VMN (orange) between 2011 and 2019, and visual observations from the IMO between 1988 and 2007 (Rendtel & Arlt 2008) or between 2002 and 2019 (VMDB in black). Video and radar observationswere scaled to visual measurements as described in Egal et al. (2020). The best-weighted simulated average profile usingone degree SL binning is drawn in red. We note the factor of two difference in the ordinate scale between the top and bottom plots.
Current usage metrics show cumulative count of Article Views (full-text article views including HTML views, PDF and ePub downloads, according to the available data) and Abstracts Views on Vision4Press platform.
Data correspond to usage on the plateform after 2015. The current usage metrics is available 48-96 hours after online publication and is updated daily on week days.
Initial download of the metrics may take a while.