Fig. 11
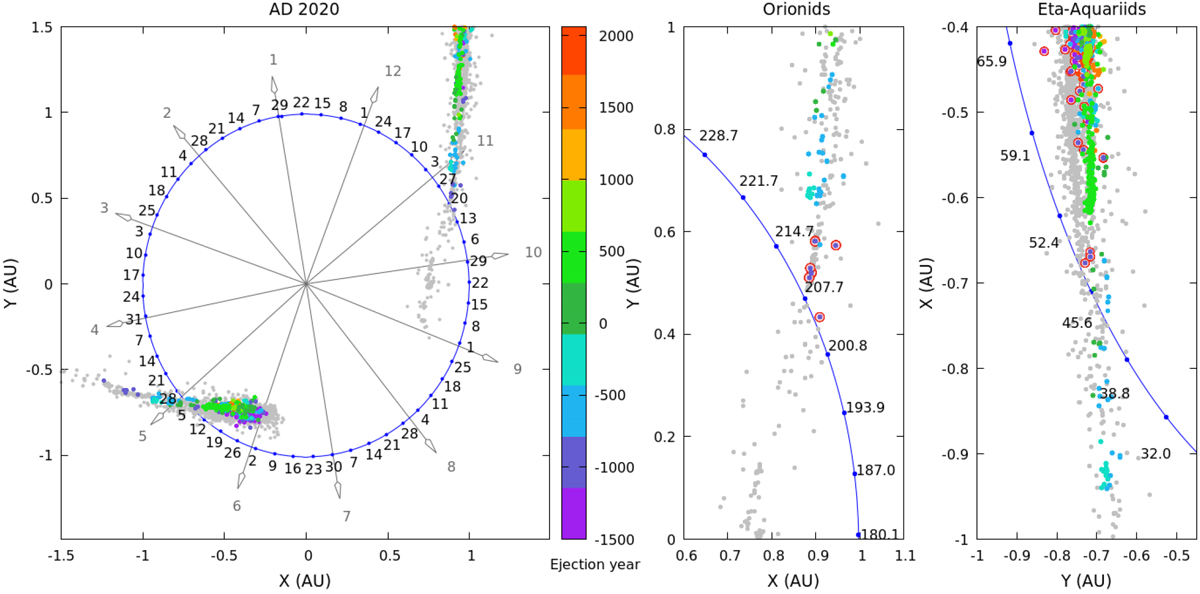
Example of the distribution of nodal locations of particles when crossing the ecliptic plane in 2020 CE as a function of their time of ejection from 1P/Halley. The regions where meteoroids have their ascending node (Orionids) and their descending node (η-Aquariids) are shown in magnified form in the middle and right panels of the figure. The position of Earth along its orbit is represented by blue dots and dates (gray arrows indicating month and dots the day of each month) or SLs (middle and right panels). Particles are color coded as a function of the ejection epoch. Meteoroids ejected when the comet was trapped in the 1:6 resonance are highlighted with red circles. Trails ejected between 3000 BCE and 1404 BCE are presented in gray as these are associated with the time frame when 1P/Halley has a less certain ephemeris. The animated figure is provided online.
Current usage metrics show cumulative count of Article Views (full-text article views including HTML views, PDF and ePub downloads, according to the available data) and Abstracts Views on Vision4Press platform.
Data correspond to usage on the plateform after 2015. The current usage metrics is available 48-96 hours after online publication and is updated daily on week days.
Initial download of the metrics may take a while.