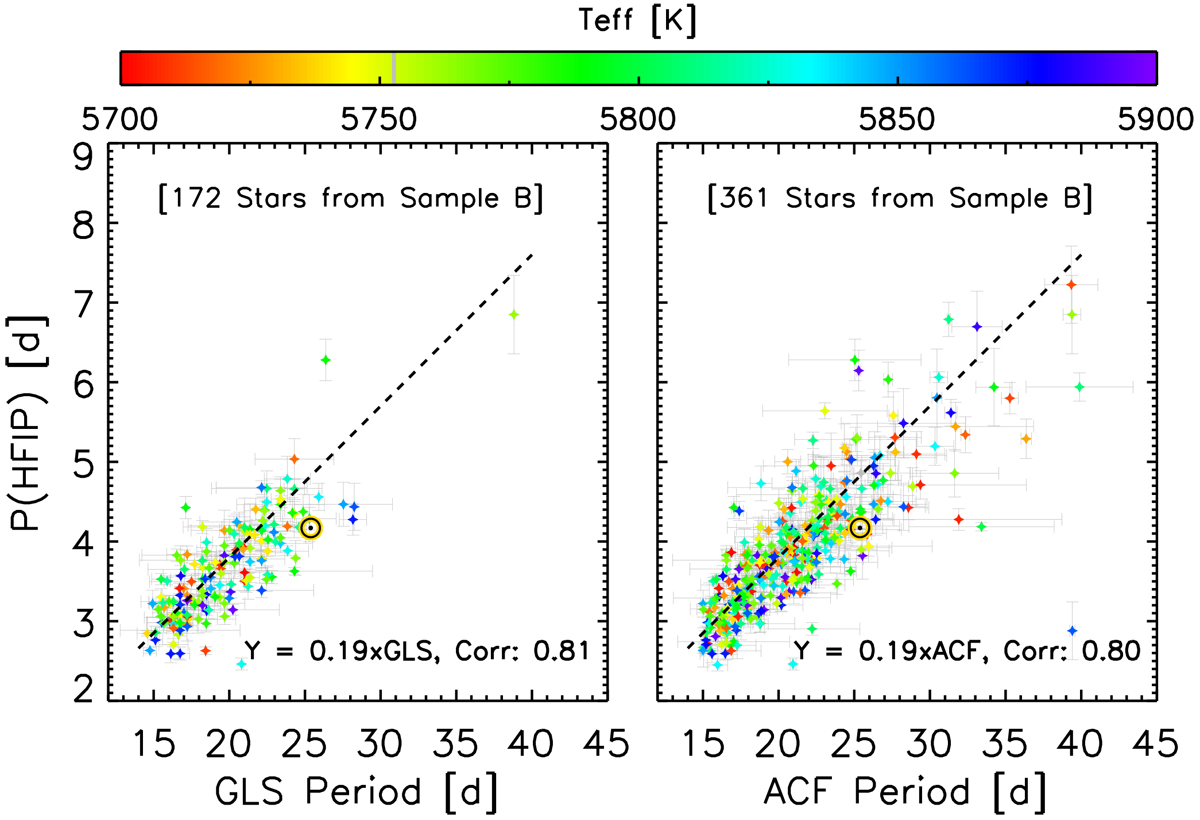
Fig. 3

Position of the high-frequency inflection point (PHFIP) plotted against rotation period. Only sample B is shown here. Rotation periods are taken from Reinhold & Gizon (2015) (left panel) and McQuillan et al. (2014) (right panel). Colours represent the stellar effective temperature, Teff. The Sun is represented by the solar symbol ⊙. Dashed lines in both panels indicate a linear fit constrained to go through the origin of the coordinate system. A logarithmic visualization is available in the appendix, see Fig. A.1.
Current usage metrics show cumulative count of Article Views (full-text article views including HTML views, PDF and ePub downloads, according to the available data) and Abstracts Views on Vision4Press platform.
Data correspond to usage on the plateform after 2015. The current usage metrics is available 48-96 hours after online publication and is updated daily on week days.
Initial download of the metrics may take a while.


