Fig. 1
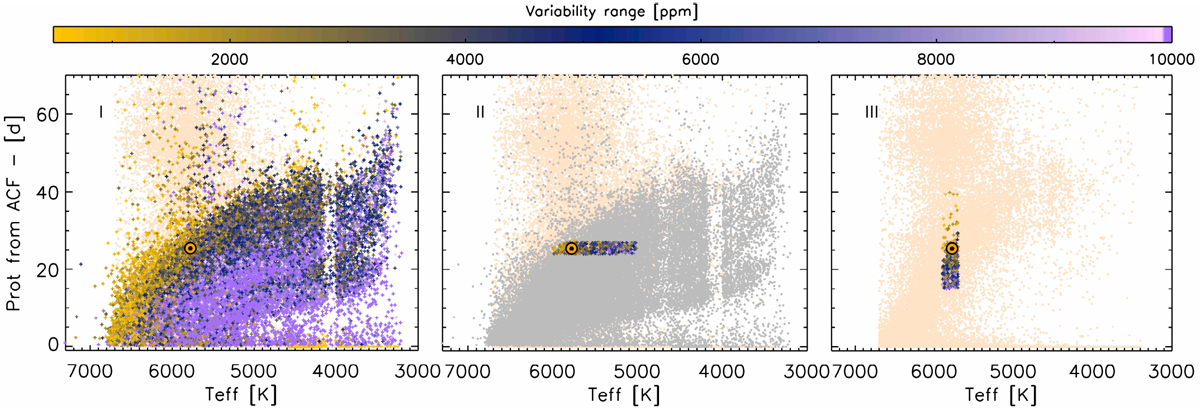
Panel I: temperature–rotation diagram for a sample of 34030 stars (coloured circles indicating the variability range) with rotation periods determined by McQuillan et al. (2014), along with 55501 stars where the authors found a period but evaluated it as not significant (beige dots; see panel III for a better visualization). Panel II: sample of 34030 stars with determined rotation periods in grey and 55501 stars with non-significant rotation period determinations in beige. For panels II and III, only the stars from sample A (panel II) and sample B (panel III) are shown in colour; see Table 1 for the properties of samples A and B. Panel II illustrates the stellar sample A, selected by near-solar rotation period and temperatures from 5000 to 6000 K. Panel III illustrates stellar sample B, which contains stars with near-solar effective temperature and a broad range of rotation periods. The Sun is represented by the solar symbol ⊙.
Current usage metrics show cumulative count of Article Views (full-text article views including HTML views, PDF and ePub downloads, according to the available data) and Abstracts Views on Vision4Press platform.
Data correspond to usage on the plateform after 2015. The current usage metrics is available 48-96 hours after online publication and is updated daily on week days.
Initial download of the metrics may take a while.