Fig. 14
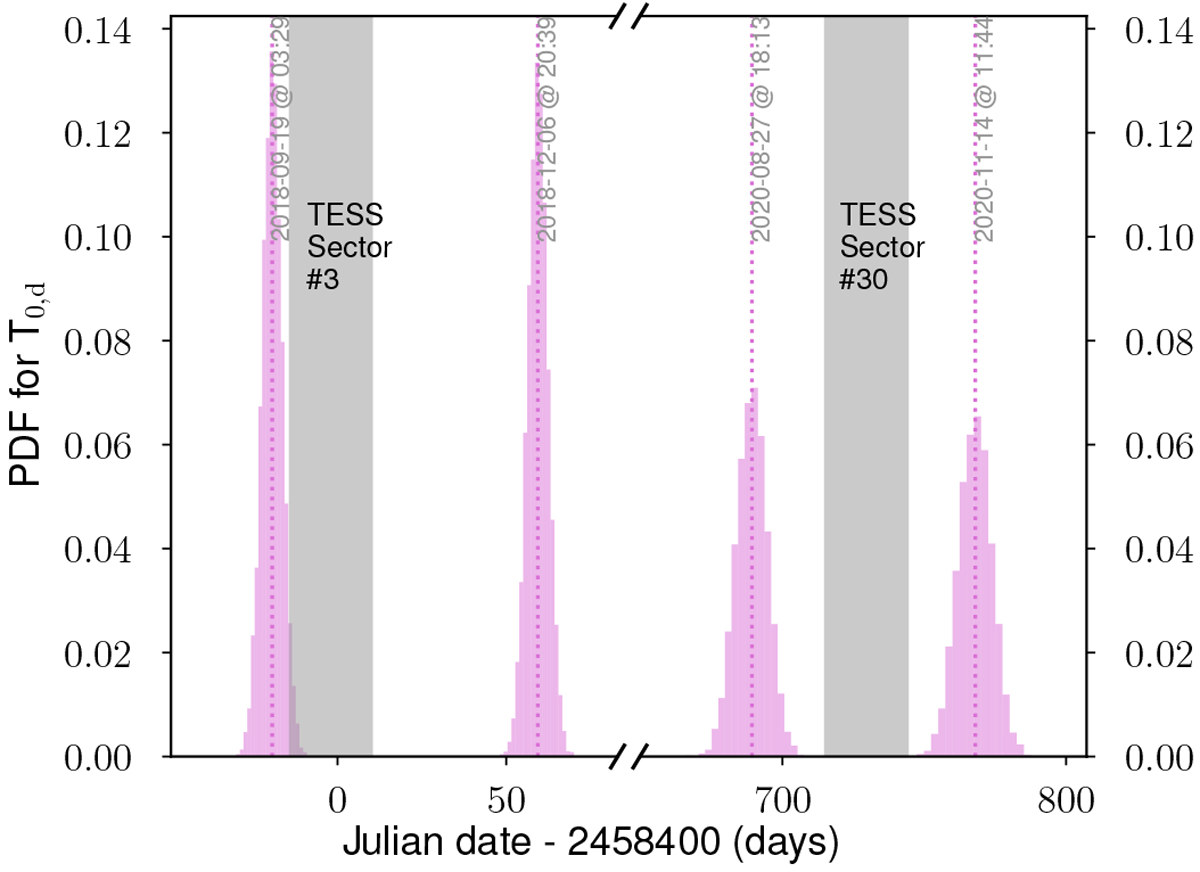
Expected posterior distribution of the mid-transit time of planet candidate LHS 1140 d (magenta histograms) and the TESS coverage of Sectors 3 and 30 on the field including the host star (shaded gray region). The median of each posterior distribution is marked by a vertical dotted line, and the corresponding calendar date in Universal Time Coordinate system is annotated.
Current usage metrics show cumulative count of Article Views (full-text article views including HTML views, PDF and ePub downloads, according to the available data) and Abstracts Views on Vision4Press platform.
Data correspond to usage on the plateform after 2015. The current usage metrics is available 48-96 hours after online publication and is updated daily on week days.
Initial download of the metrics may take a while.