Fig. 9.
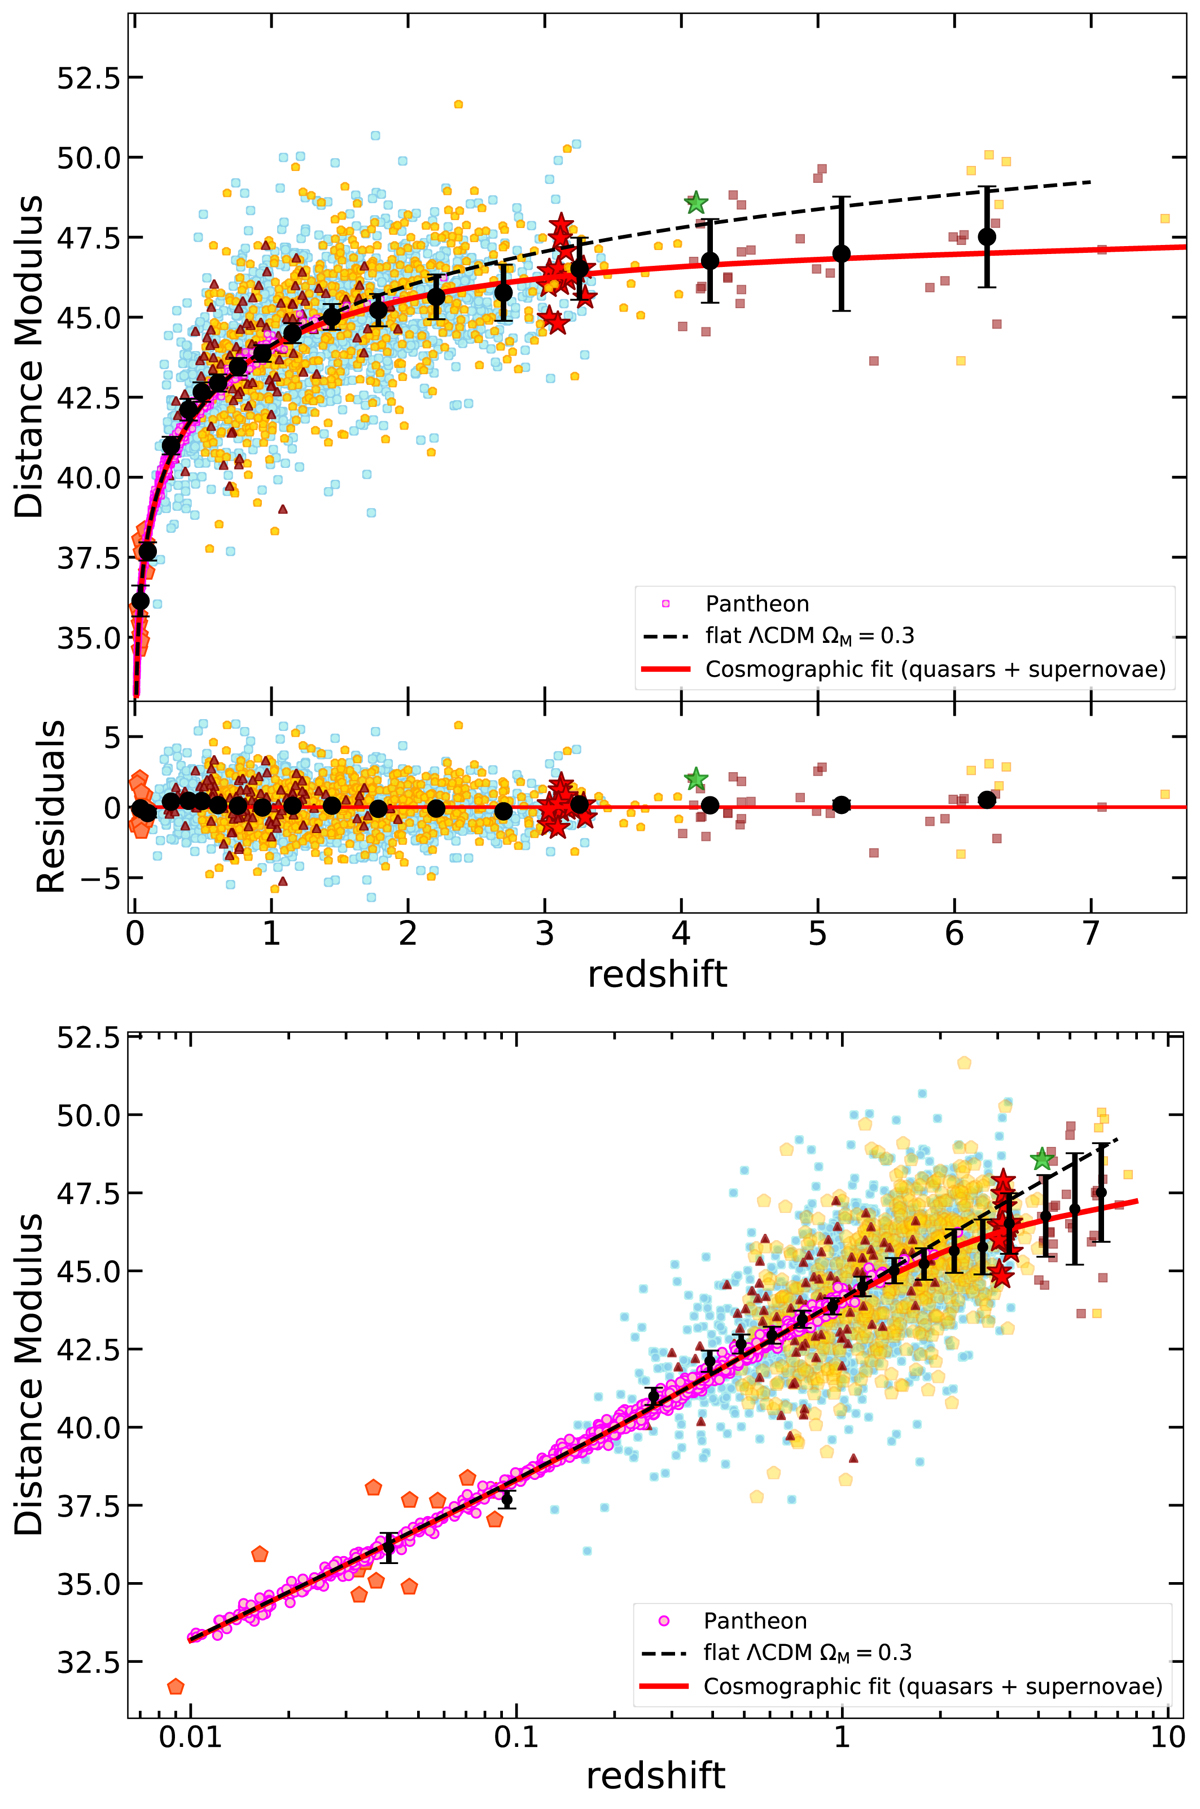
Top panel: distance modulus–redshift relation (Hubble diagram) for the clean quasar sample and supernovae Ia (Pantheon, magenta points). Symbol keys are the same as in Fig. 1. The red line represents a fifth order cosmographic fit of the data, whilst the black points are averages (along with their uncertainties) of the distance moduli in narrow (logarithmic) redshift intervals. The dashed black line shows a flat ΛCDM model fit with ΩM = 0.3. Middle panel: residuals with respect to the cosmographic fit and the black points are the averages of the residuals over the same redshift intervals. Bottom panel: distance modulus–redshift relation plotted with a logarithmic horizontal axis scale to better visualise the agreement between supernovae Ia and quasars in the low-redshift range.
Current usage metrics show cumulative count of Article Views (full-text article views including HTML views, PDF and ePub downloads, according to the available data) and Abstracts Views on Vision4Press platform.
Data correspond to usage on the plateform after 2015. The current usage metrics is available 48-96 hours after online publication and is updated daily on week days.
Initial download of the metrics may take a while.