Fig. 7.
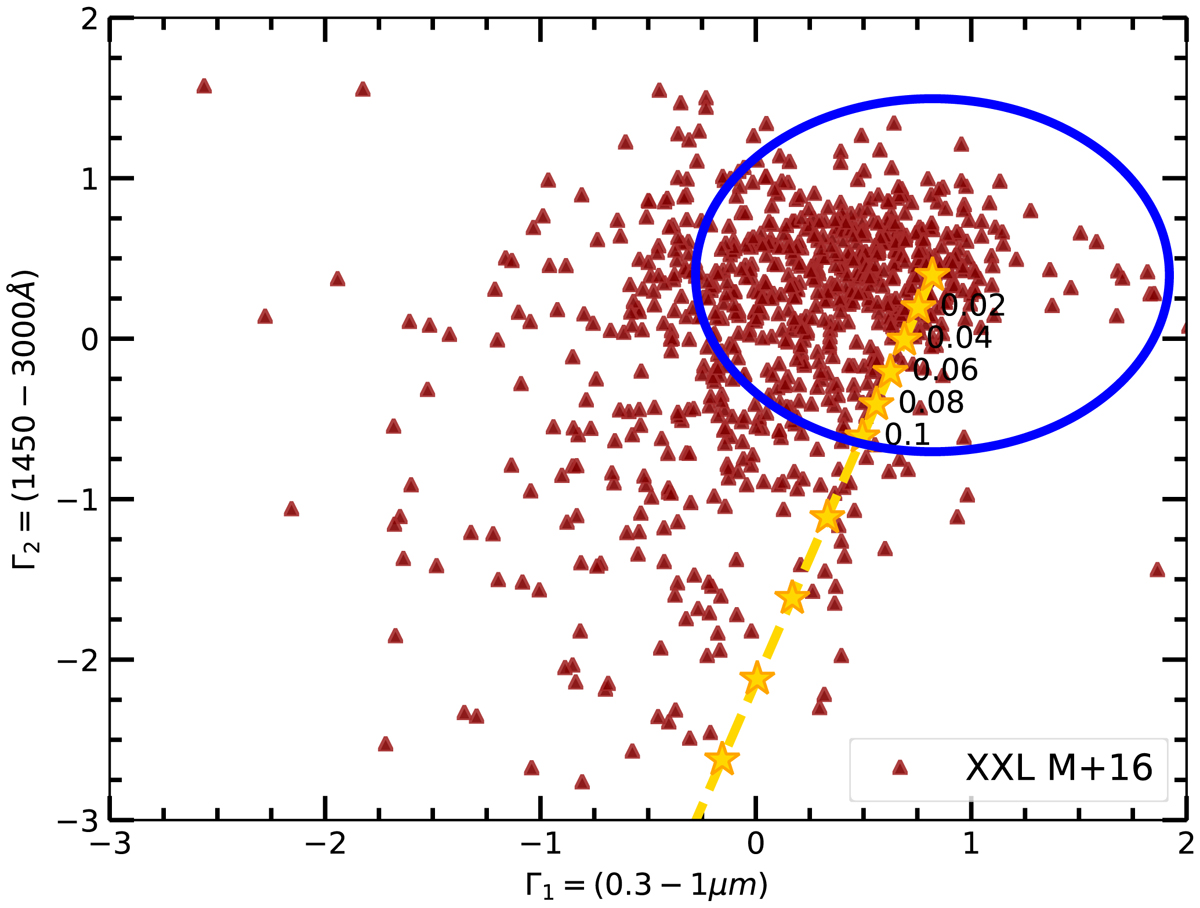
Example of the Γ1 − Γ2 distribution for the XXL quasar sample, where Γ1 and Γ2 are the slopes of a power law in the log(ν)−log(νLν) plane in the 0.3–1 μm and 1450–3000 Å intervals, respectively (see Sect. 7.1). The stars represent the Γ1 − Γ2 values of the quasar SED by Richards et al. (2006) with increasing dust reddening (following the extinction law of Prevot et al. 1984), with E(B − V) in the range 0–0.3. We selected all the quasars inside the blue circle (i.e. with minimum host-galaxy and dust reddening contamination).
Current usage metrics show cumulative count of Article Views (full-text article views including HTML views, PDF and ePub downloads, according to the available data) and Abstracts Views on Vision4Press platform.
Data correspond to usage on the plateform after 2015. The current usage metrics is available 48-96 hours after online publication and is updated daily on week days.
Initial download of the metrics may take a while.