Fig. 6.
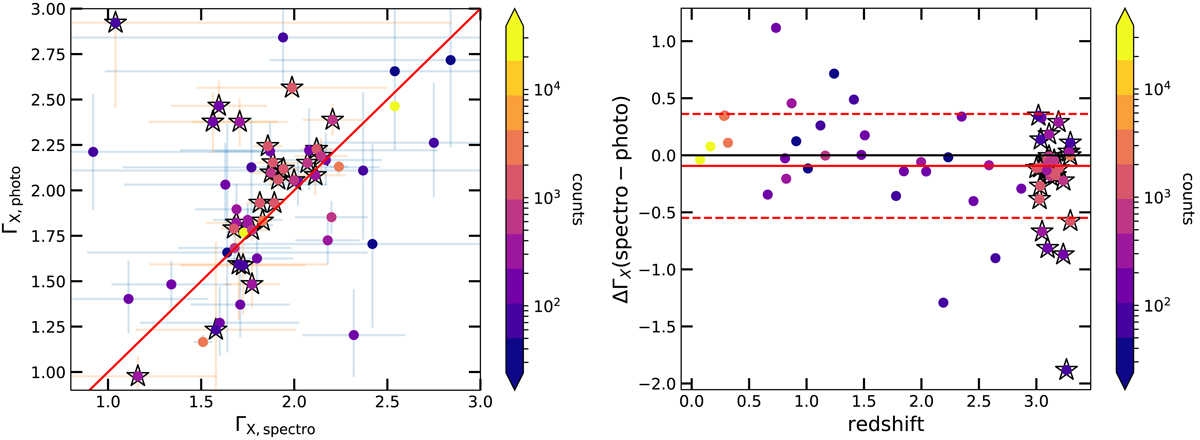
Top panel: comparison between the spectroscopic and photometric photon indices for 30 quasars randomly extracted from the SDSS–4XMM sample and the quasars of the z ≃ 3 sample (Nardini et al. 2019, marked with open star symbols). Bottom panel: difference between the spectroscopic and photometric photon index values as a function of redshift. The mean ΔΓX = ΓX, spectro − ΓX, photo value and its 1σ dispersion are shown with the red and dashed lines, respectively. Points are colour-coded by the number of net counts. Although the ΓX distribution along the one-to-one relation is rather scattered, the ΔΓX does not seem to show a clear trend with redshift.
Current usage metrics show cumulative count of Article Views (full-text article views including HTML views, PDF and ePub downloads, according to the available data) and Abstracts Views on Vision4Press platform.
Data correspond to usage on the plateform after 2015. The current usage metrics is available 48-96 hours after online publication and is updated daily on week days.
Initial download of the metrics may take a while.