Fig. 3.
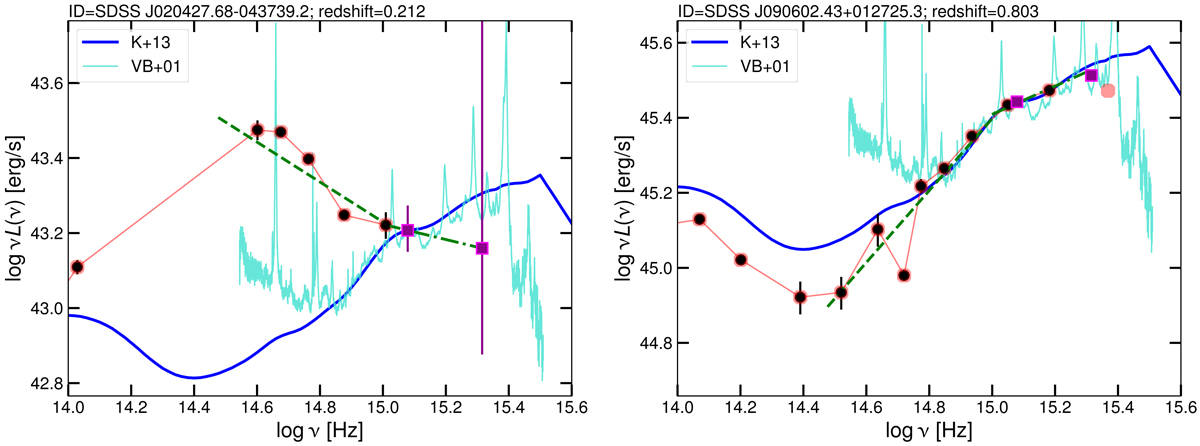
Examples of AGN SEDs. The red circles mark all the available photometry from the SDSS catalogue, whilst the ones used to construct the SEDs are highlighted with black circles. The magenta squares represent the luminosities at 2500 Å and 1450 Å. The cyan line is the composite SDSS quasar spectrum from Vanden Berk (2001), whilst the blue solid line is the average SDSS quasar SED from Krawczyk et al. (2013). Both composites are normalised to 2500 Å. The green dashed and dot-dashed lines represent the two near-infrared and optical slopes Γ1 and Γ2 in the 0.3–1 μm and 1450–3000 Å range (rest frame), respectively. The SED in the left panel is representative of an AGN that does not fulfil our selection criteria (see Sect. 7), as it is affected by both host-galaxy contamination and dust absorption in the UV. The SED in the right panel, instead, is characteristic of an object with low levels of contaminants, which therefore belongs to the clean AGN sample.
Current usage metrics show cumulative count of Article Views (full-text article views including HTML views, PDF and ePub downloads, according to the available data) and Abstracts Views on Vision4Press platform.
Data correspond to usage on the plateform after 2015. The current usage metrics is available 48-96 hours after online publication and is updated daily on week days.
Initial download of the metrics may take a while.