Fig. C.1.
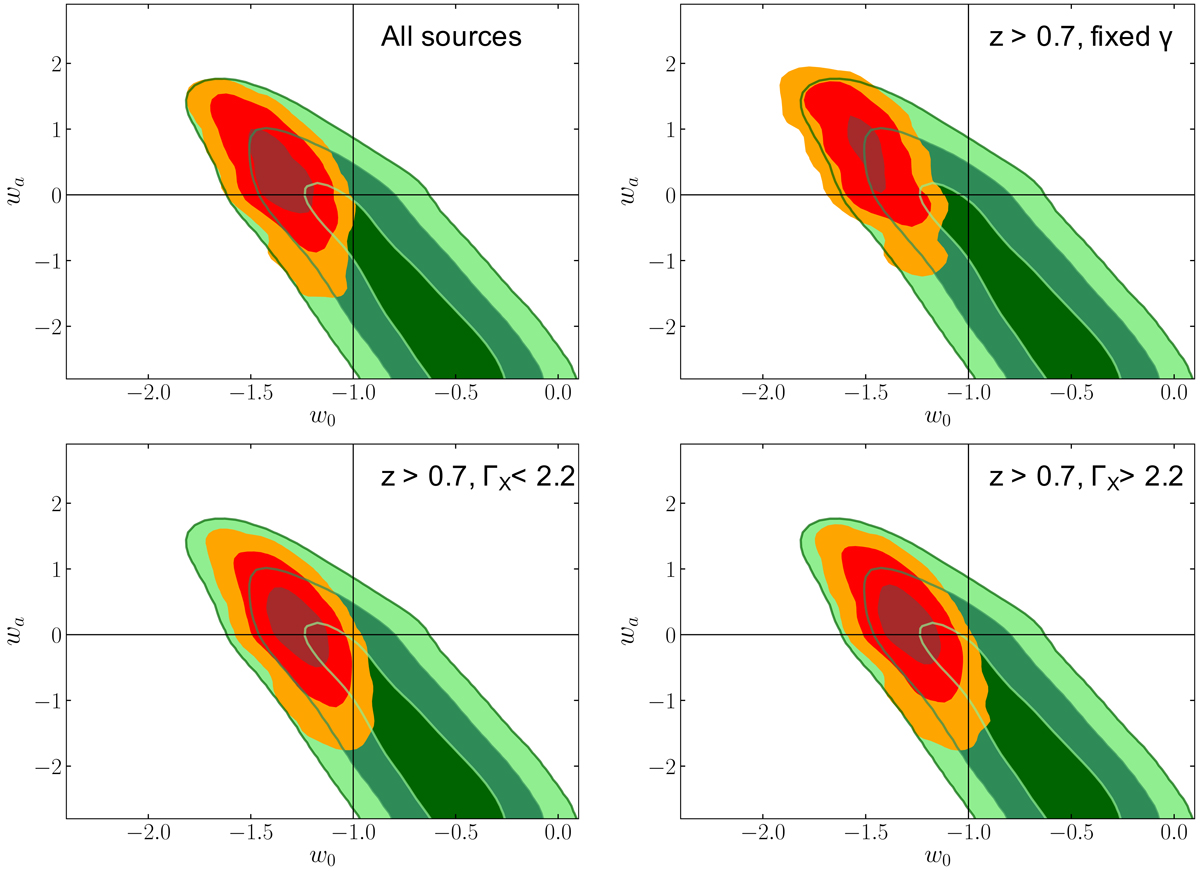
Results from a fit of a w0waCDM model to our Hubble diagram of supernovae and quasars in four different cases. Top left: whole quasar sample, with the slope of the LX − LUV relation as a free parameter; top right: quasars at z > 0.7 with a fixed LX − LUV slope, γ = 0.59, that is the average value from the fit of the relation in narrow redshift intervals, as shown in Sect. 8; bottom panels: results for two sub-samples with ΓX < 2.2 and ΓX > 2.2. Contours are at the 1σ, 2σ, and 3σ confidence levels. The green contours refer to the CMB results from Planck (Planck Collaboration VI 2020). The orange, red, and brown contours are obtained by adding the constraints from the Hubble diagram of supernovae and quasars.
Current usage metrics show cumulative count of Article Views (full-text article views including HTML views, PDF and ePub downloads, according to the available data) and Abstracts Views on Vision4Press platform.
Data correspond to usage on the plateform after 2015. The current usage metrics is available 48-96 hours after online publication and is updated daily on week days.
Initial download of the metrics may take a while.