Fig. 2.
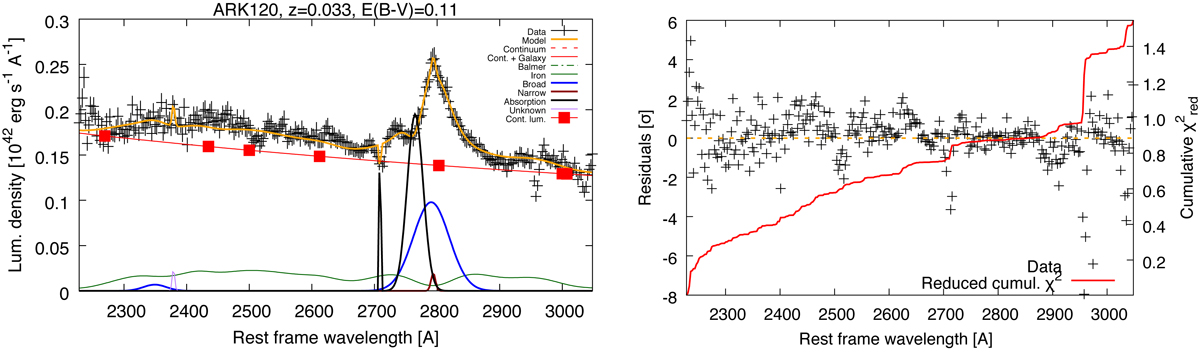
Example of UV spectral fitting. Best-fit model (left panel, orange curve) and residuals (right panel, in units of 1σ uncertainties on the data and cumulative reduced χ2) are presented for Ark 120. Redshift and Galactic extinction at the source location are shown on top of the plot. The main model components are plotted with different colours: the solid red line is the sum of continuum and host galaxy components; the black solid line is the absorption component; the dot-dashed green line is the Balmer component; the solid green line is the UV iron template; the sum of all broad and narrow emission-line components is shown with blue and brown lines, respectively. The red square symbols are the continuum luminosities estimated by QSFit.
Current usage metrics show cumulative count of Article Views (full-text article views including HTML views, PDF and ePub downloads, according to the available data) and Abstracts Views on Vision4Press platform.
Data correspond to usage on the plateform after 2015. The current usage metrics is available 48-96 hours after online publication and is updated daily on week days.
Initial download of the metrics may take a while.