Fig. 17.
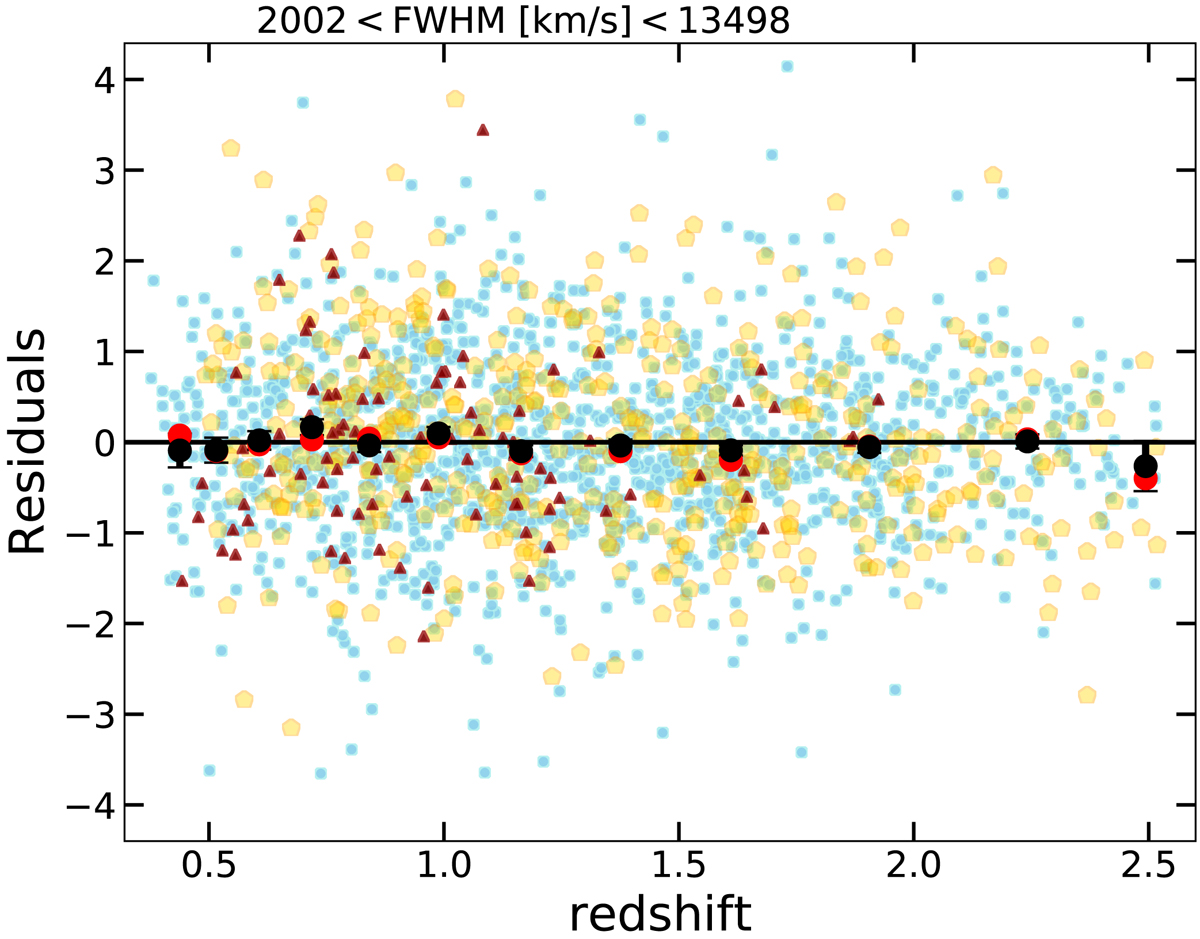
Distribution of the Hubble diagram residuals (middle panel of Fig. 9) as a function of redshift for the quasars with a broad (FWHM > 2000 km s−1) component of the Mg II emission line in the clean sample. The black and red points represent the mean and median of the residuals in narrow redshift intervals, respectively. Symbol keys as in Fig. 1.
Current usage metrics show cumulative count of Article Views (full-text article views including HTML views, PDF and ePub downloads, according to the available data) and Abstracts Views on Vision4Press platform.
Data correspond to usage on the plateform after 2015. The current usage metrics is available 48-96 hours after online publication and is updated daily on week days.
Initial download of the metrics may take a while.