Free Access
Fig. 14.
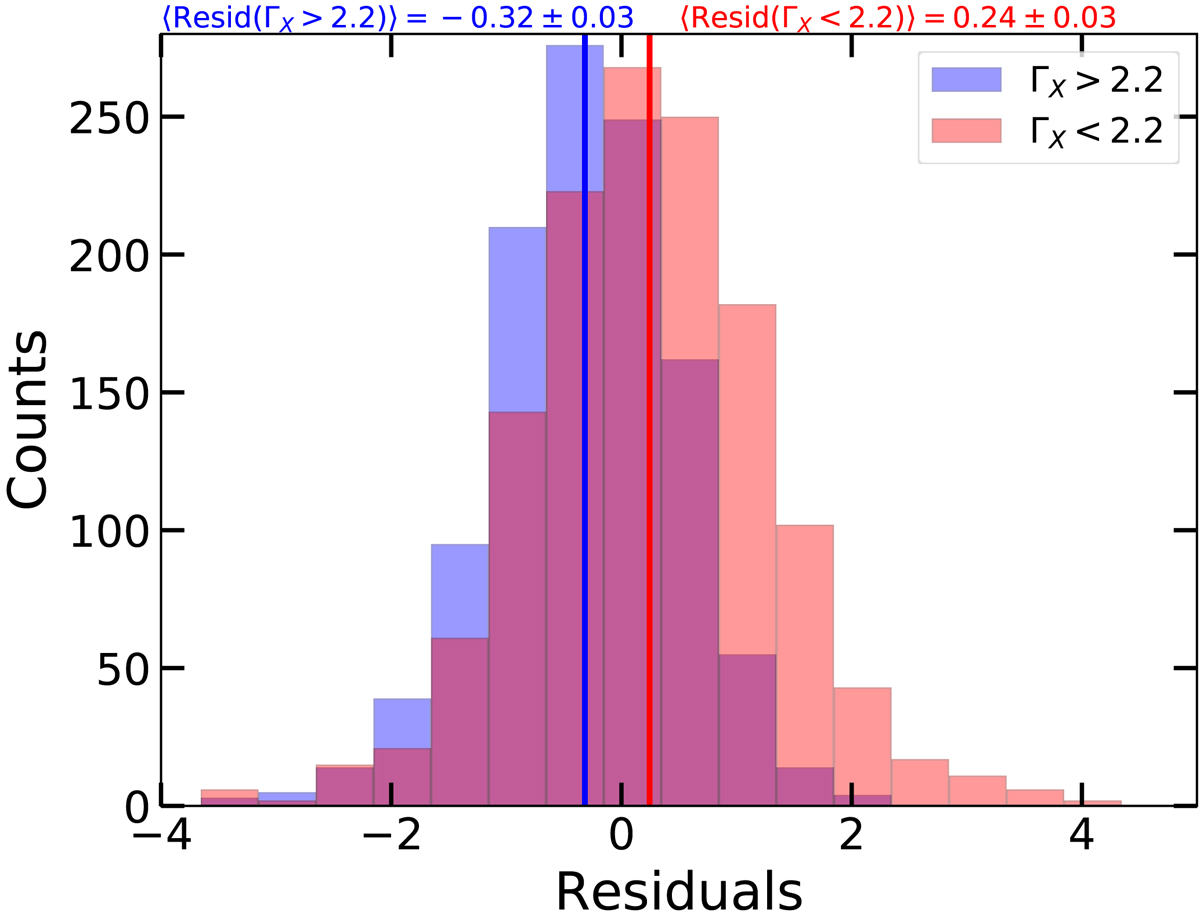
Distribution of the Hubble diagram residuals (middle panel of Fig. 9) for the quasars with ΓX higher (blue) and lower (red) than the average (i.e. ⟨ΓX⟩ = 2.2, see Fig. 12). The blue and red solid lines represent the mean of the residuals in each ΓX distribution, respectively (averages are reported on top).
Current usage metrics show cumulative count of Article Views (full-text article views including HTML views, PDF and ePub downloads, according to the available data) and Abstracts Views on Vision4Press platform.
Data correspond to usage on the plateform after 2015. The current usage metrics is available 48-96 hours after online publication and is updated daily on week days.
Initial download of the metrics may take a while.