Free Access
Fig. 12.
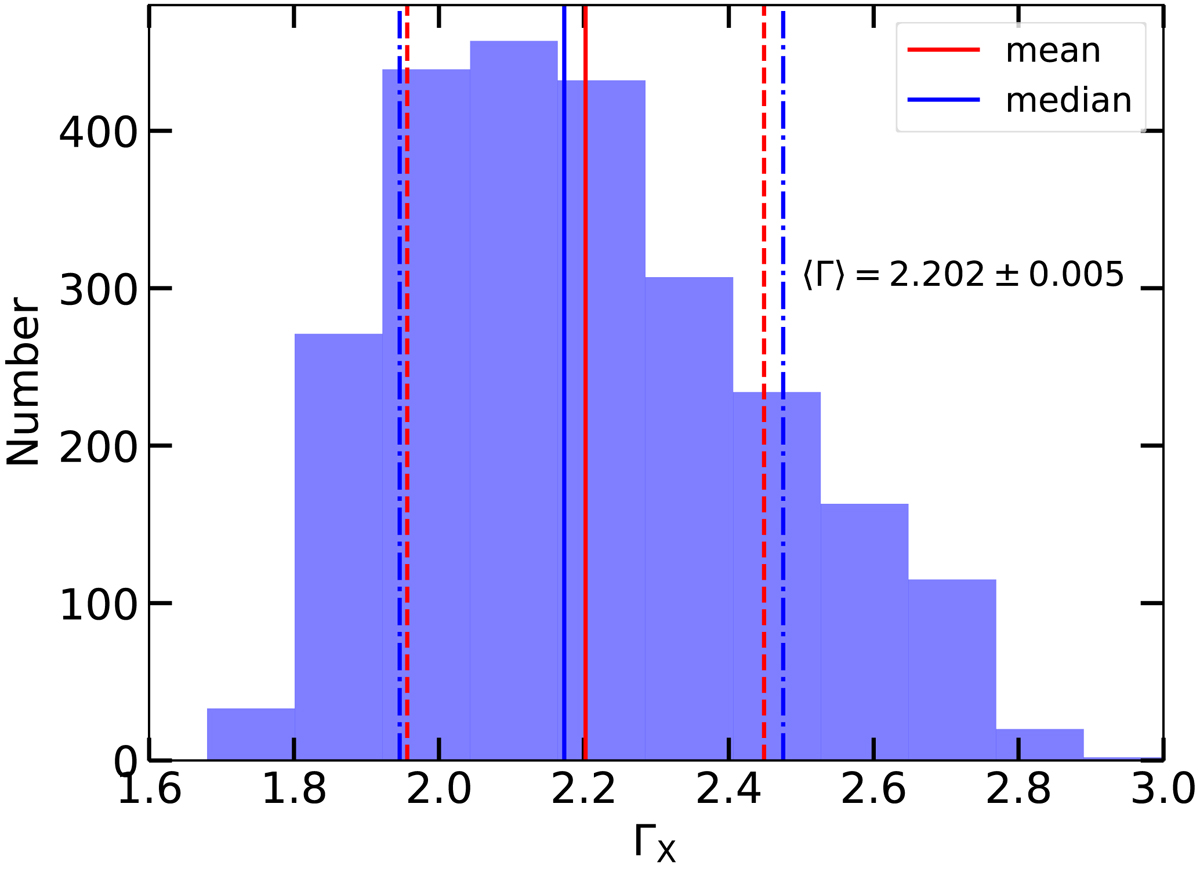
Distribution of the photon index ΓX for the clean final sample. The mean and the statistical error on the mean are also quoted. The red (blue) solid line represents the mean (median) of ΓX, with its 1σ dispersion around the average marked with the dashed (dot-dashed, 16% and 84%) lines.
Current usage metrics show cumulative count of Article Views (full-text article views including HTML views, PDF and ePub downloads, according to the available data) and Abstracts Views on Vision4Press platform.
Data correspond to usage on the plateform after 2015. The current usage metrics is available 48-96 hours after online publication and is updated daily on week days.
Initial download of the metrics may take a while.