Fig. 1.
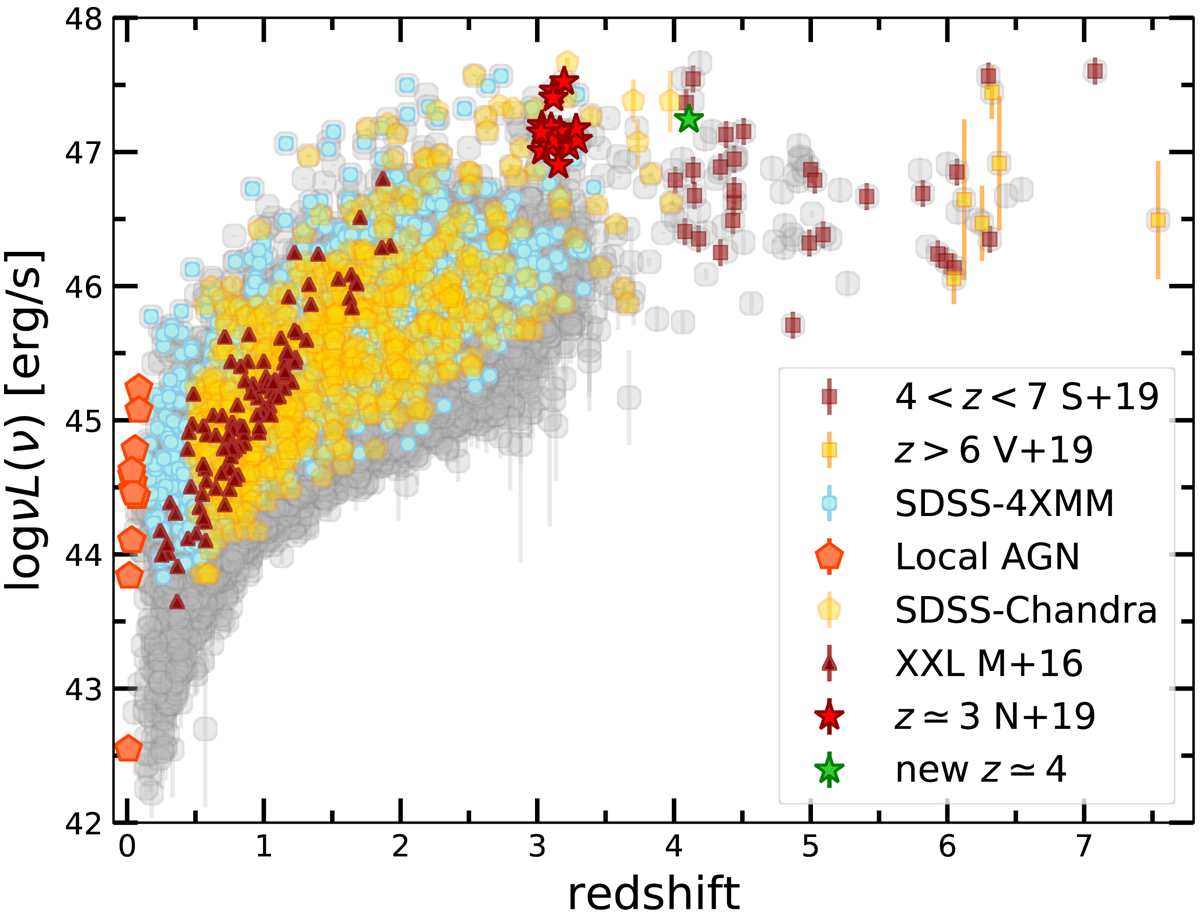
Distribution of luminosities at rest-frame 2500 Å as a function of redshift for the main (grey points) and the selected (cleaned) samples (see Sect. 7.4). Brown and yellow squares: high-z sample (Salvestrini et al. 2019; Vito et al. 2019, see Sect. 2.6), cyan points: SDSS–4XMM (Sect. 2.1), brown triangles: XMM–XXL (Menzel et al. 2016, Sect. 2.3), orange pentagons: the local AGN sample (Sect. 2.7), red stars: z ≃ 3 quasar sample (Nardini et al. 2019, green star: new z ≃ 4 quasar (Sect. 2.5), gold pentagons: SDSS–Chandra (Sect. 2.2).
Current usage metrics show cumulative count of Article Views (full-text article views including HTML views, PDF and ePub downloads, according to the available data) and Abstracts Views on Vision4Press platform.
Data correspond to usage on the plateform after 2015. The current usage metrics is available 48-96 hours after online publication and is updated daily on week days.
Initial download of the metrics may take a while.