Fig. 7
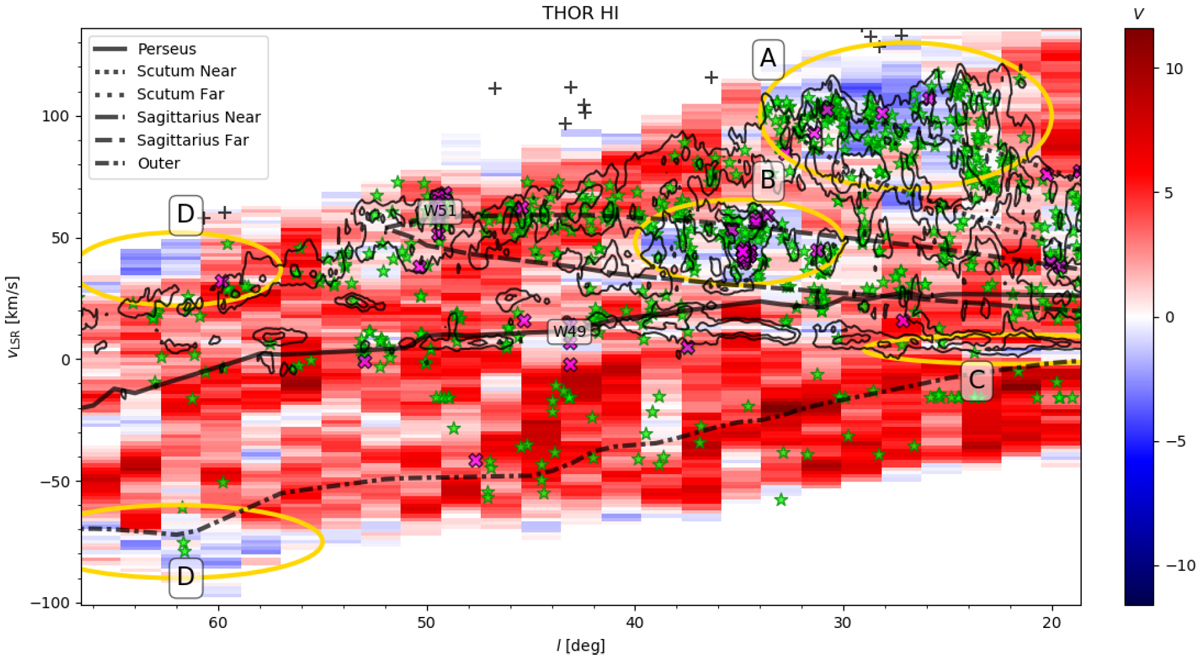
Projected Rayleigh statistic (V) corresponding to the orientation of the filamentary structures identified with the Hessian matrix method in the HI emission in 2° × 2° tiles and across velocity channels. The overlaid curves correspond to selected spiral arms from the model presented in Reid et al. (2016). The black contours corresponds to the 97 and 99 percentile of the 12CO emission in the observations presented in Dame et al. (2001) integrated over the Galactic longitude range |b| ≤ 1°. The green stars correspond to the HII regions in the WISE catalog of Galactic HII regions (Anderson et al. 2014). The two most prominent regions of high-mass star formation in this portion of the Galaxy, W49 and W51, are indicated by the corresponding labels. The magenta crosses correspond to the 1720-MHz OH masers in the catalog (Beuther et al. 2019), which are typically excited by shocks. The black crosses correspond to the compact HI clouds at high forbidden velocities identified in the VGPS (Stil et al. 2006b). The ellipses labeled with letters indicate the regions of interest (ROIs) discussed in Sect. 5.2.
Current usage metrics show cumulative count of Article Views (full-text article views including HTML views, PDF and ePub downloads, according to the available data) and Abstracts Views on Vision4Press platform.
Data correspond to usage on the plateform after 2015. The current usage metrics is available 48-96 hours after online publication and is updated daily on week days.
Initial download of the metrics may take a while.