Fig. 4
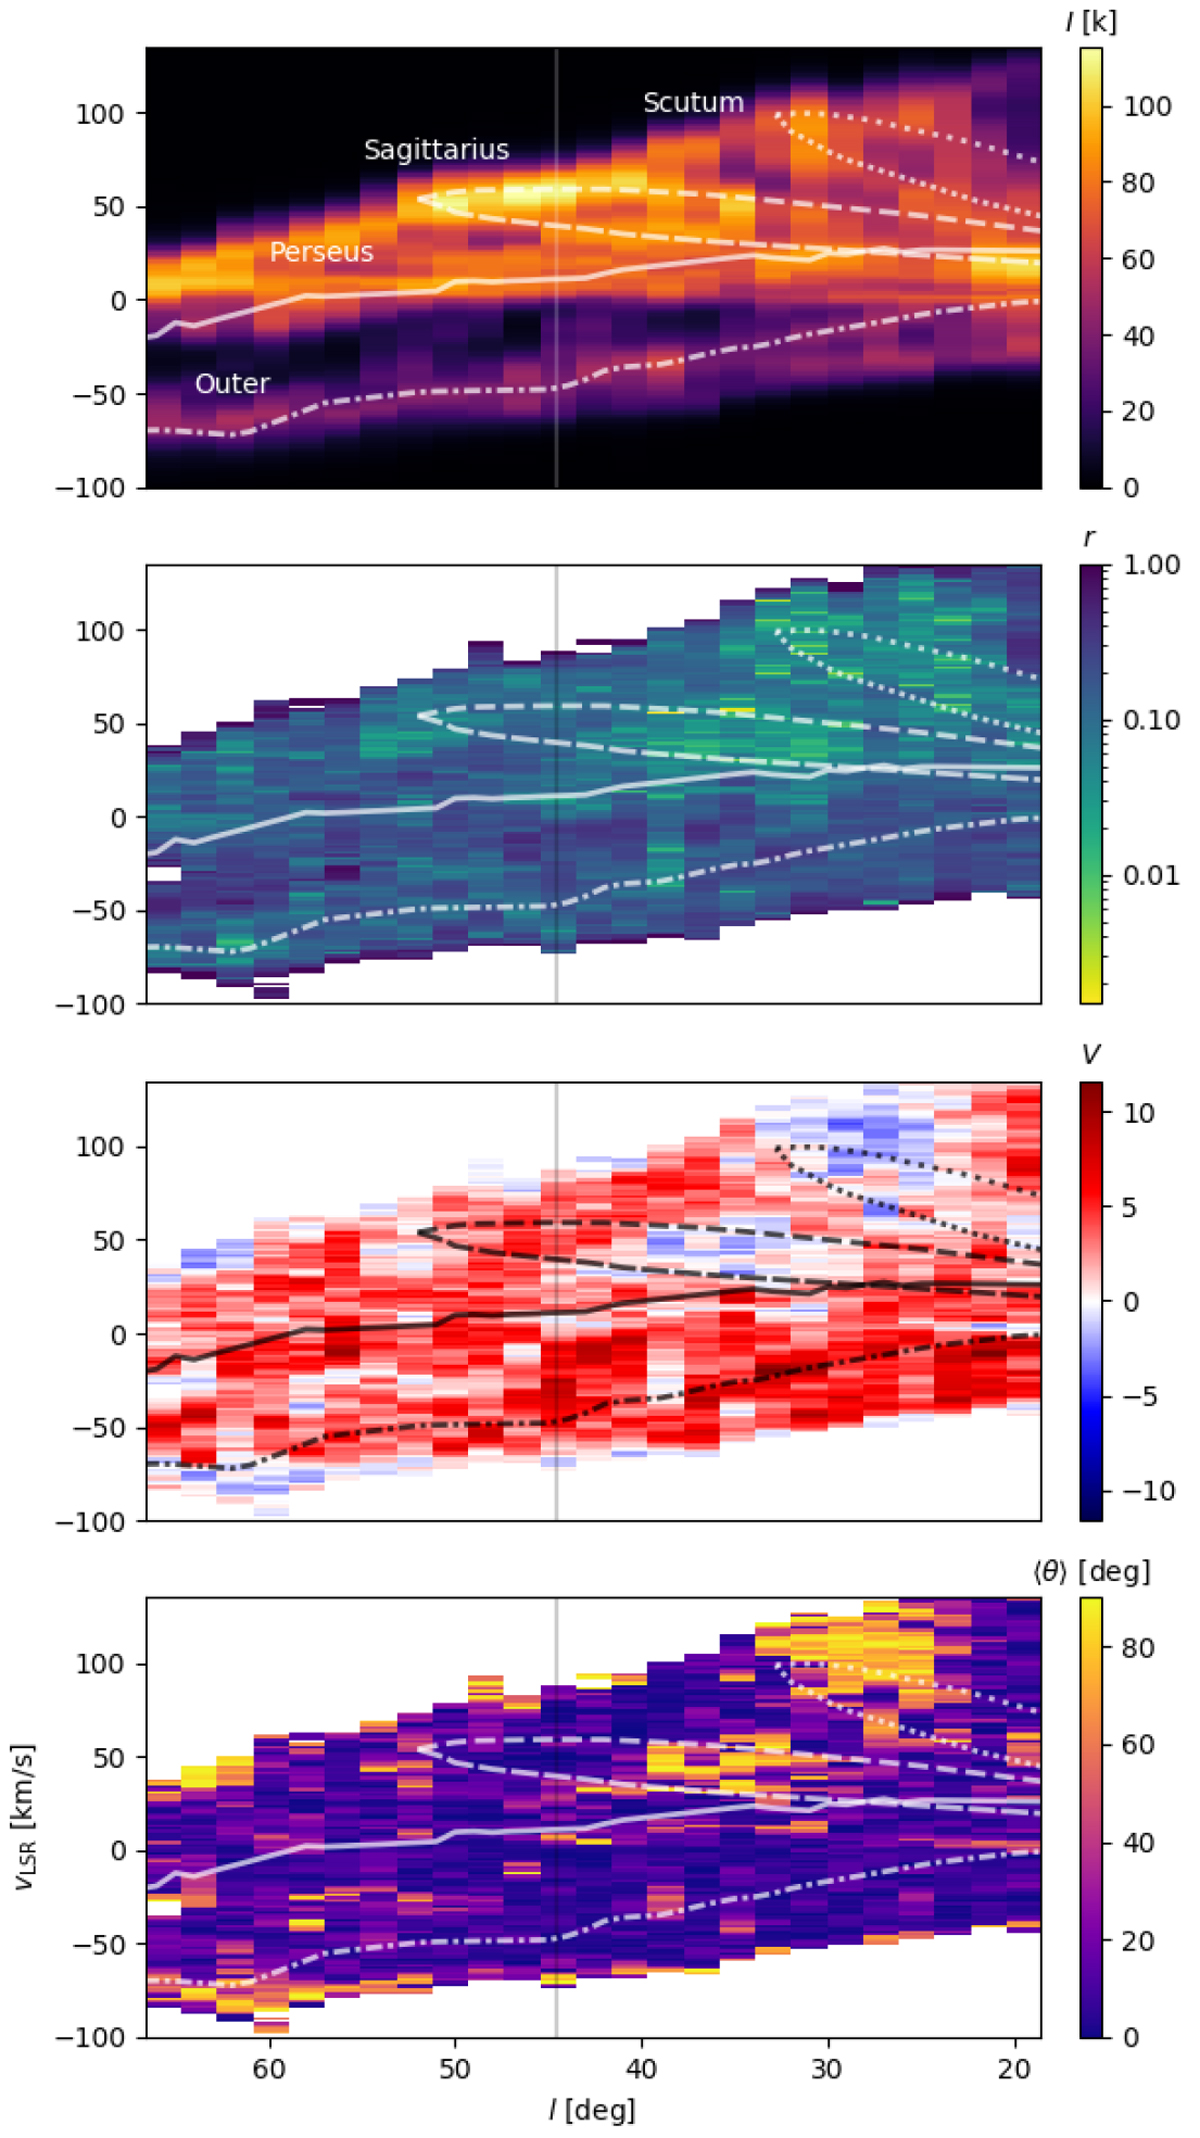
Longitude-velocity (lv) diagrams corresponding to the mean intensity and the results of the Hessian analysis of the velocity-channel maps in the region covered by the THOR observations. Each pixel in the diagrams represents the quantities calculated in 2° × 2° tile in a 1.5 km s−1-velocity channel as follows. Top: mean HI intensity (I). Middle top: mean resulting vector (r). Middle bottom: projected Rayleigh statistic (V). Bottom: mean orientation angle (![]() ) of the HI filamentary structures, which is only well-defined if r > 0. The overlaid curves correspond to selected spiral arms from the model presented in Reid et al. (2016). The vertical line indicates thecentral l
of the 2° × 2° tile presented inFig. 1 and whose circular statistics are shown in Fig. 3.
) of the HI filamentary structures, which is only well-defined if r > 0. The overlaid curves correspond to selected spiral arms from the model presented in Reid et al. (2016). The vertical line indicates thecentral l
of the 2° × 2° tile presented inFig. 1 and whose circular statistics are shown in Fig. 3.
Current usage metrics show cumulative count of Article Views (full-text article views including HTML views, PDF and ePub downloads, according to the available data) and Abstracts Views on Vision4Press platform.
Data correspond to usage on the plateform after 2015. The current usage metrics is available 48-96 hours after online publication and is updated daily on week days.
Initial download of the metrics may take a while.