Fig. 3
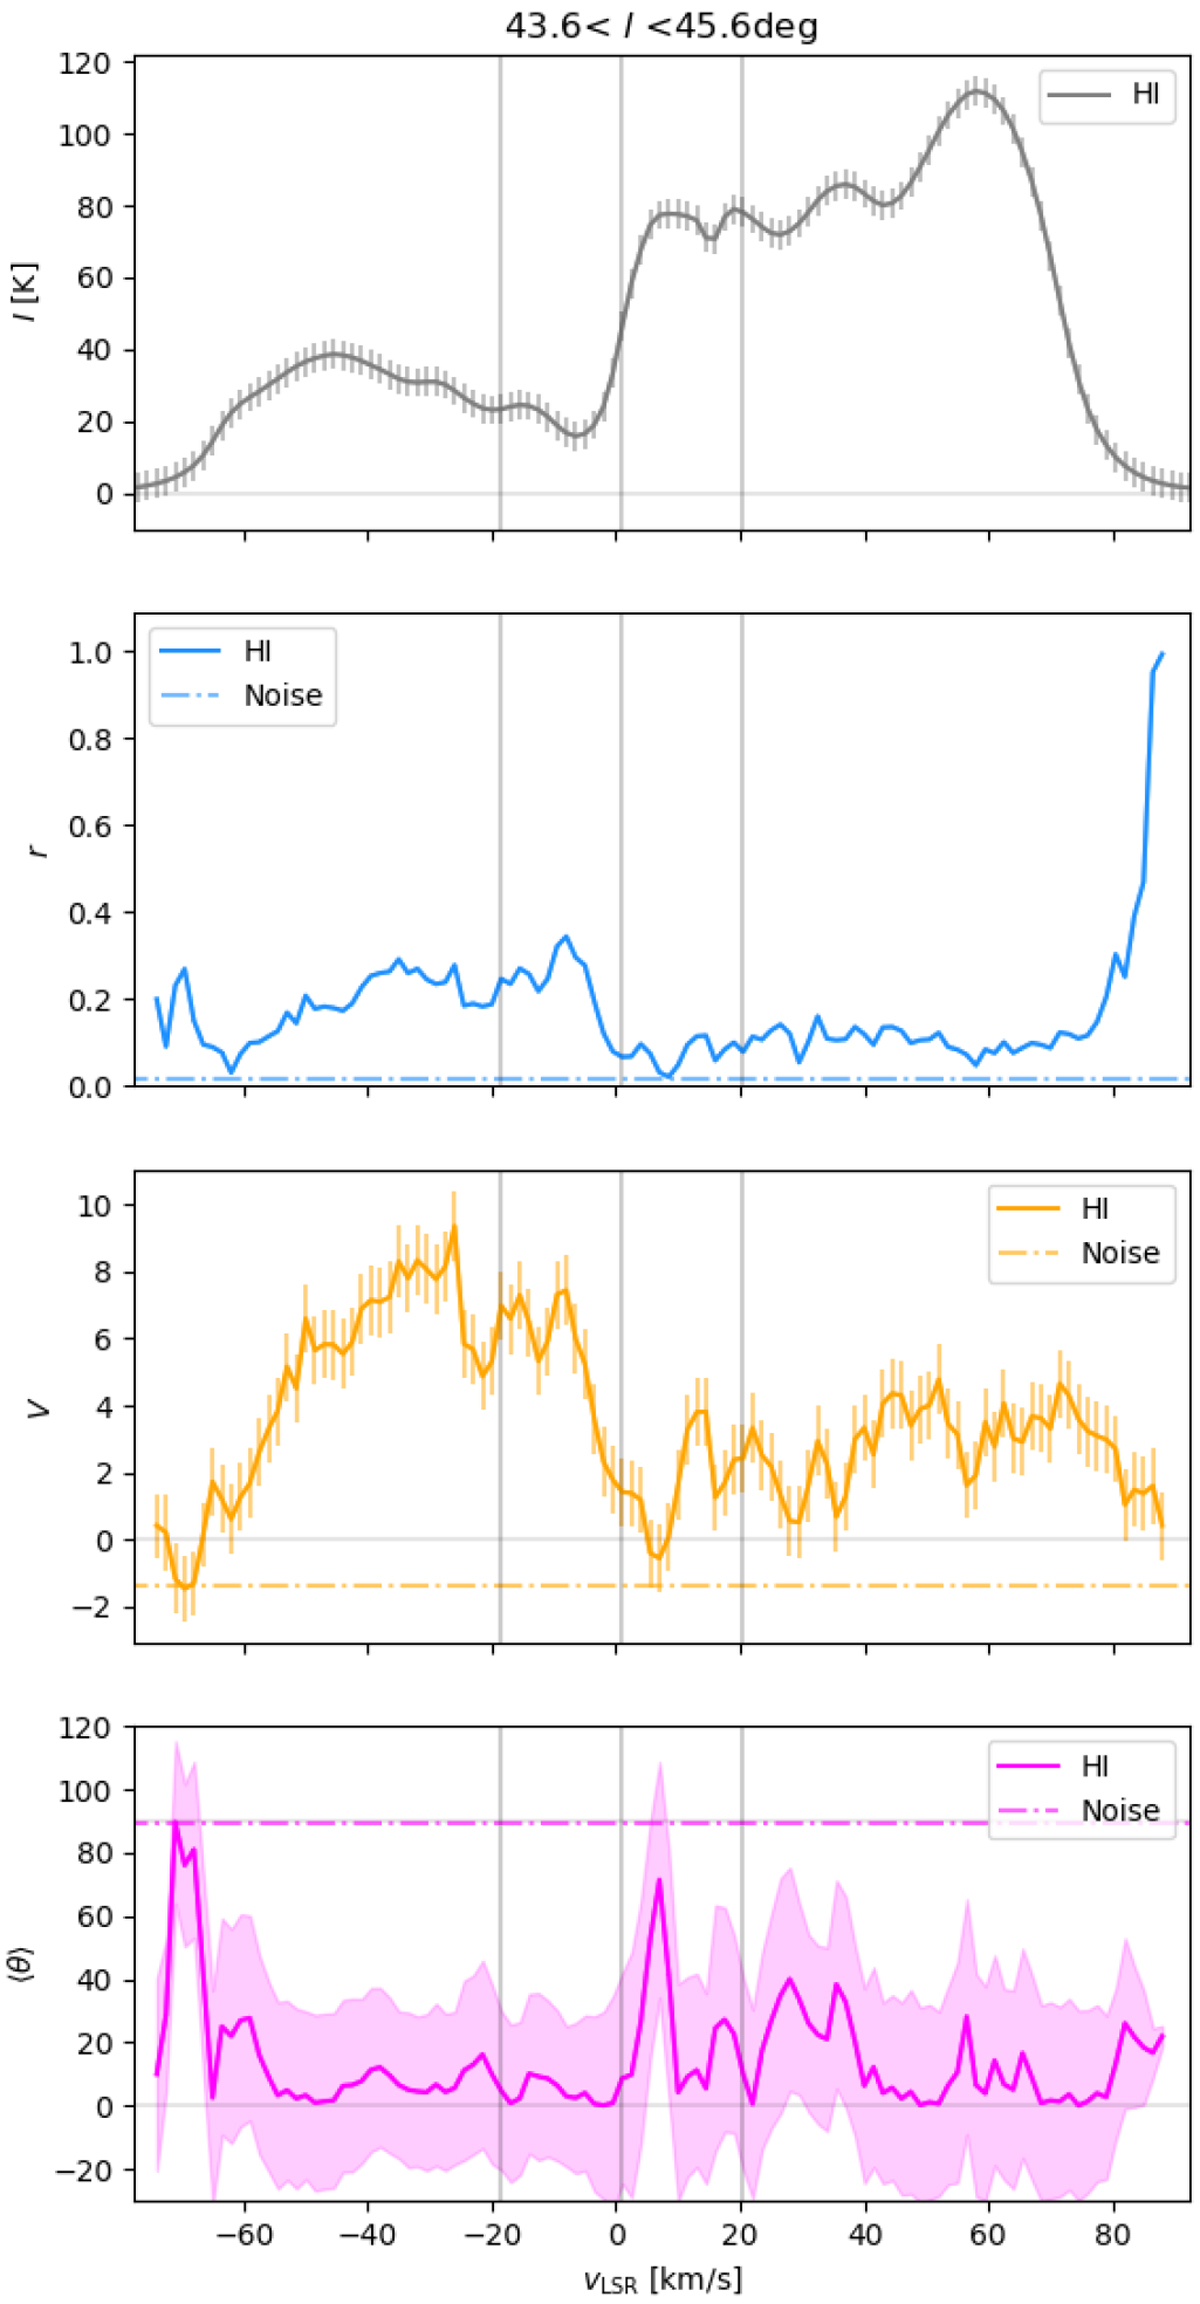
Mean spectrum and circular statistics used for the study of the orientation of the HI filamentary structures across velocity channels toward the region presented in Fig. 1. Top: mean HI intensity (I). Middle top: mean resulting vector (r), which indicates if the distribution of orientation angles is flat (r ≈ 0) or sharply unimodal (r ≈ 1). Middle bottom: projected Rayleigh statistic (V), which indicates if the distribution of orientation angles is clearly peaked around 0° (V ≫ 0) or 90° (V ≪ 0). Bottom: circular mean (![]() ) and standard deviation (σV) of the orientation angles, represented by the line and the shaded area, respectively. The error bars correspond to the observation uncertainties and the error propagation based on the Monte Carlo sampling introduced in Appendix A.1. The dashed horizontal lines in each panel indicate the values of those quantities in the 1.4 GHz noise maps used to characterize the effect of the side lobes and continuum sources in the HI maps. The vertical gray lines correspond to the velocity channels shown in Fig. 1.
) and standard deviation (σV) of the orientation angles, represented by the line and the shaded area, respectively. The error bars correspond to the observation uncertainties and the error propagation based on the Monte Carlo sampling introduced in Appendix A.1. The dashed horizontal lines in each panel indicate the values of those quantities in the 1.4 GHz noise maps used to characterize the effect of the side lobes and continuum sources in the HI maps. The vertical gray lines correspond to the velocity channels shown in Fig. 1.
Current usage metrics show cumulative count of Article Views (full-text article views including HTML views, PDF and ePub downloads, according to the available data) and Abstracts Views on Vision4Press platform.
Data correspond to usage on the plateform after 2015. The current usage metrics is available 48-96 hours after online publication and is updated daily on week days.
Initial download of the metrics may take a while.