Fig. 15
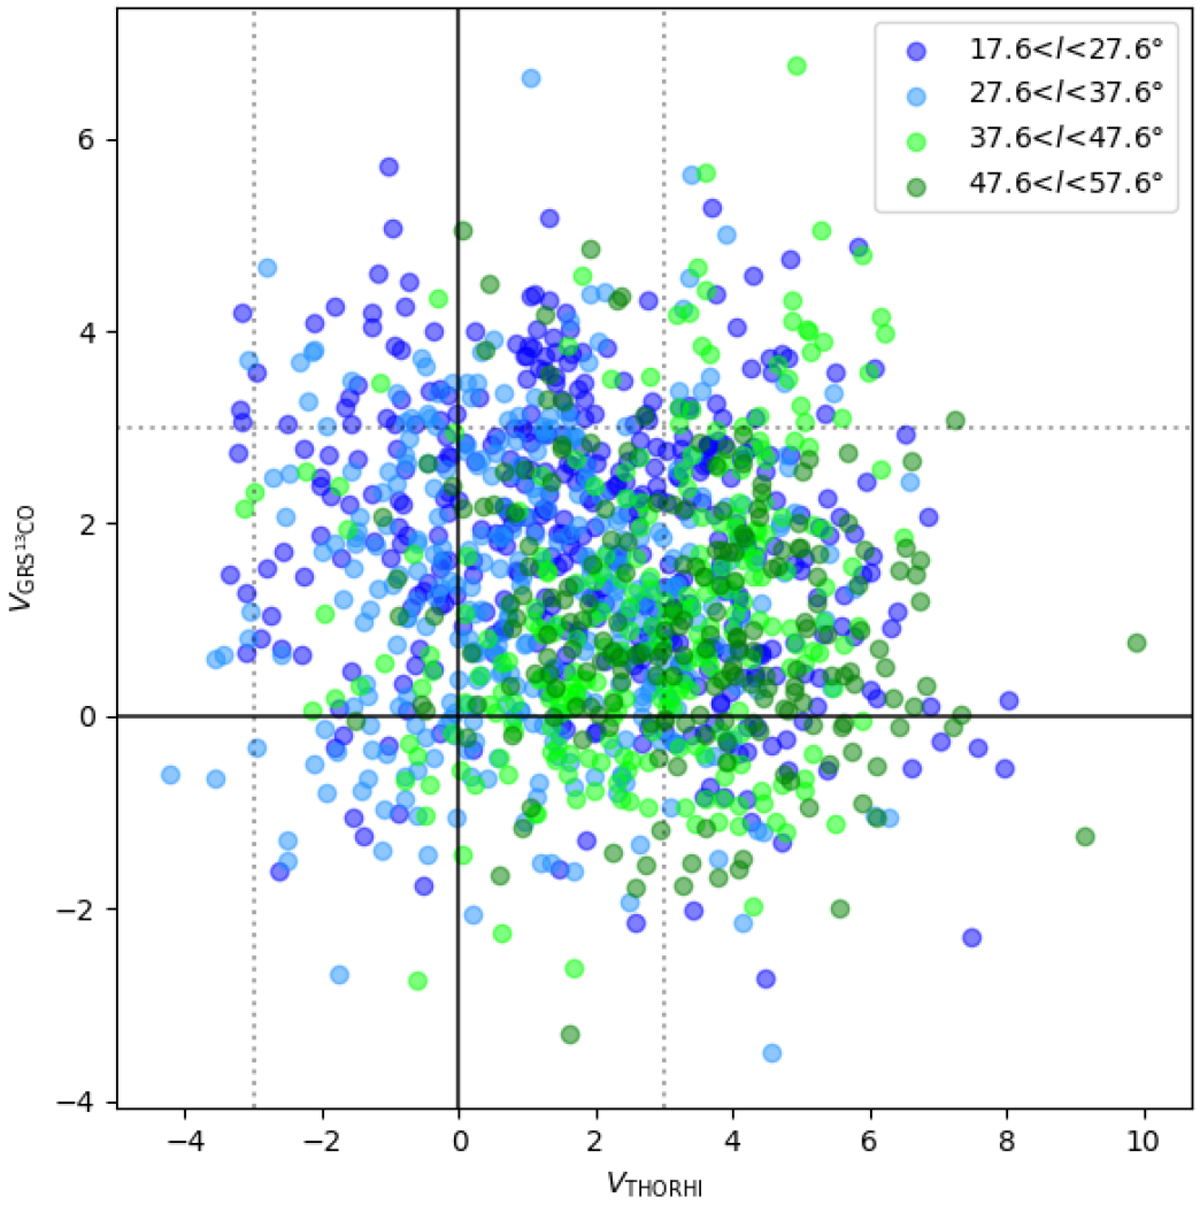
Comparison between the values of the projected Rayleigh statistic V calculated using the THOR and 13CO GRS observations in the indicated Galactic-longitude ranges. Both are calculated using a derivative kernel with 120′′ FWHM. Each point in the scatter plot corresponds to the values estimated using the Hessian analysis in the same 2° × 2° tile and 1.5-km s−1 velocity channel in both datasets.
Current usage metrics show cumulative count of Article Views (full-text article views including HTML views, PDF and ePub downloads, according to the available data) and Abstracts Views on Vision4Press platform.
Data correspond to usage on the plateform after 2015. The current usage metrics is available 48-96 hours after online publication and is updated daily on week days.
Initial download of the metrics may take a while.