Open Access
Fig. 7.
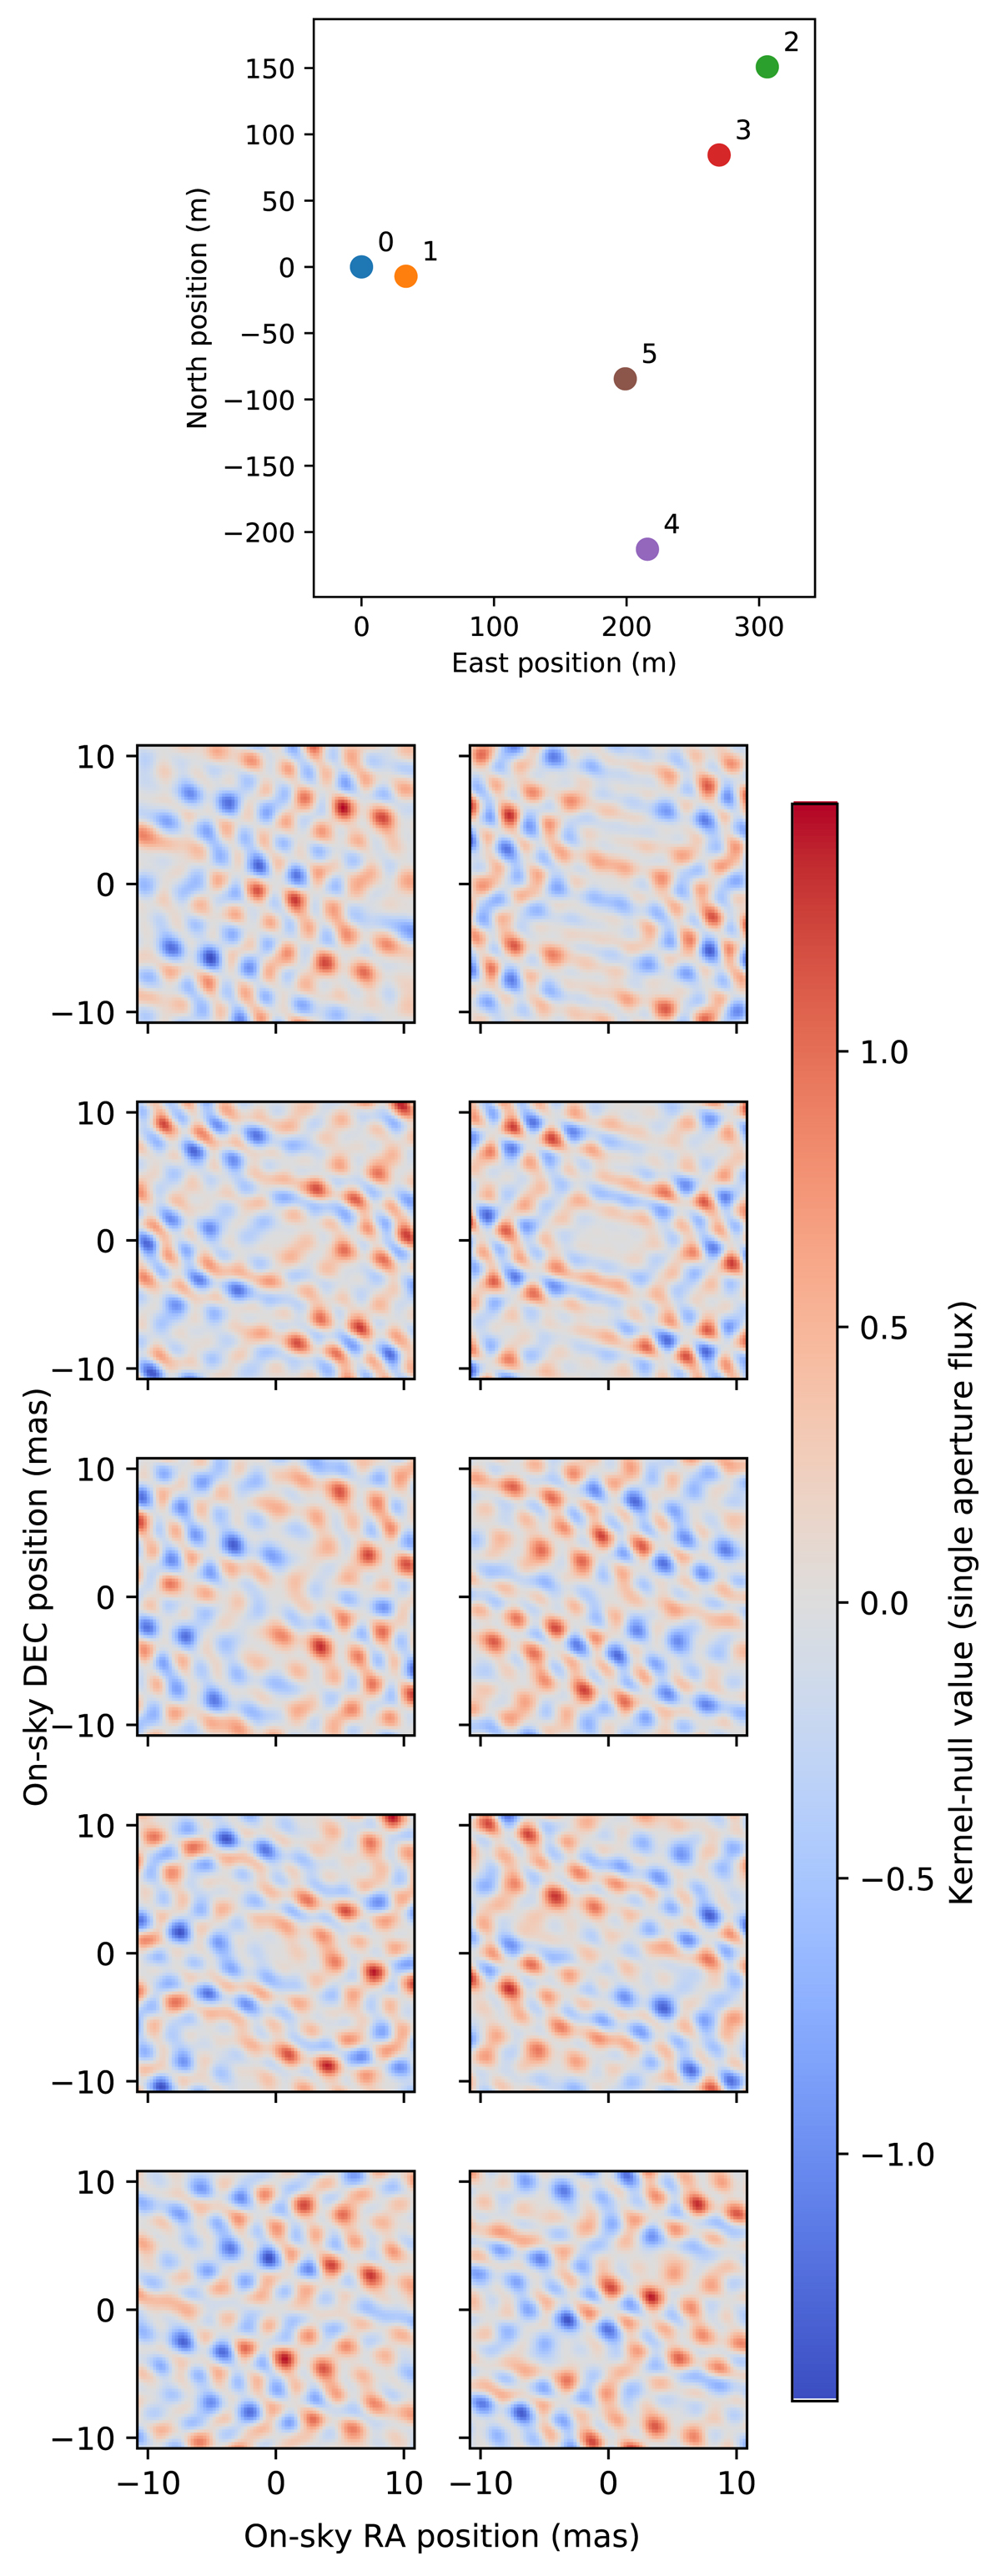
Top: six-telescope configuration for the CHARA array used as example. Bottom: value of all ten kernel nulls as a function of the relative position of a source at the wavelength 3.6 μm observed at zenith. The transmission is normalized by the flux of a single aperture. Again, each map remains antisymmetric.
Current usage metrics show cumulative count of Article Views (full-text article views including HTML views, PDF and ePub downloads, according to the available data) and Abstracts Views on Vision4Press platform.
Data correspond to usage on the plateform after 2015. The current usage metrics is available 48-96 hours after online publication and is updated daily on week days.
Initial download of the metrics may take a while.