Fig. 3.
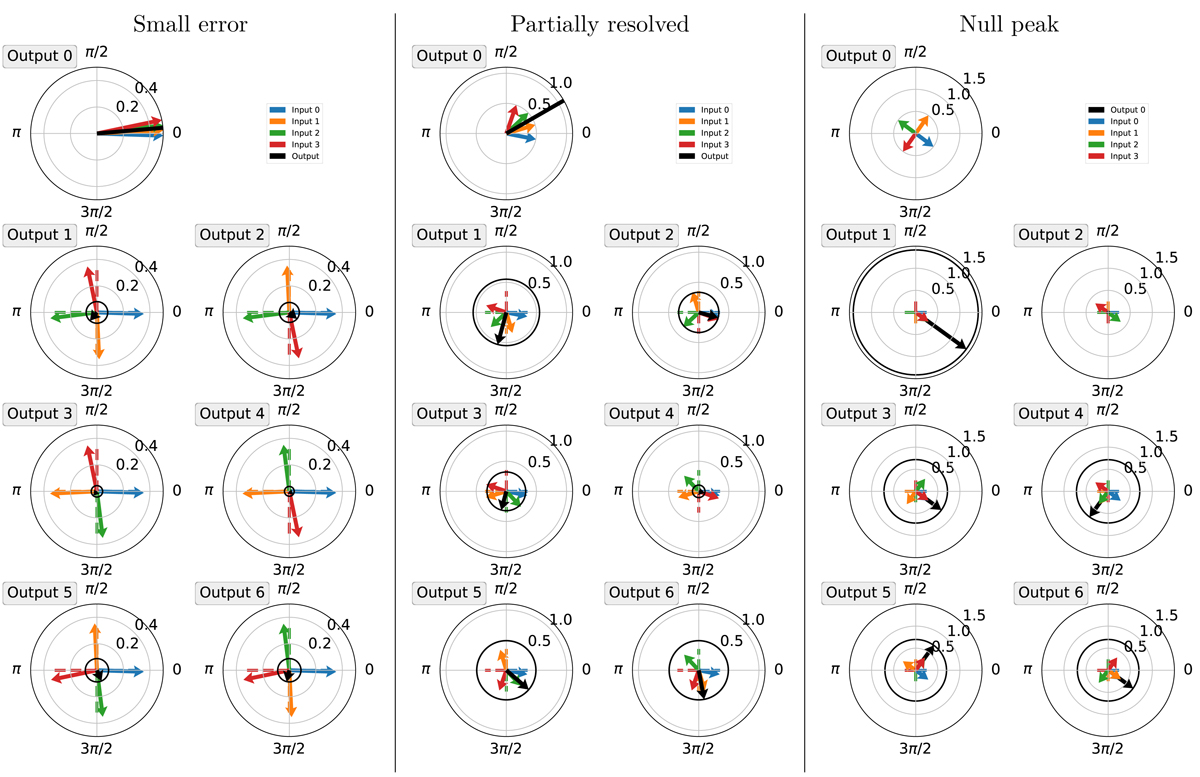
CMP for a four-input combiner, representing the coefficients of the combiner matrix ![]() (dashed lines), functionally equivalent to M4, and the contributions of the complex amplitude of an example input electric field (solid arrows) to the output electric field represented in black. Most dashed lines are hidden under the arrows. A black circle of radius equal to the modulus of this output is plotted for a visual cue, its area being proportional to the corresponding intensity. Enantiomorph pairs that generate kernel combinations by subtraction are represented side by side. As do Martinache & Ireland (2018), we use the example of the VLTI UT configuration observing at zenith at a wavelength of 3.6 μm. Left panel: source located at 0.2 mas from the optical axis and for which the corresponding input phase shifts are within the small phase approximation. As a result, the output intensities within each pair are fully correlated and result in no kernel signal. Center panel: source located 1.1 mas off-axis, which generates larger phase shifts. As a result, the null intensities from the enantiomorph pairs begin to decorrelate and generate kernel-null signal. Right panel: source located 4.3 mas from the optical axis, in the position where the first nulled output peaks. At this position the second output gets to zero.
(dashed lines), functionally equivalent to M4, and the contributions of the complex amplitude of an example input electric field (solid arrows) to the output electric field represented in black. Most dashed lines are hidden under the arrows. A black circle of radius equal to the modulus of this output is plotted for a visual cue, its area being proportional to the corresponding intensity. Enantiomorph pairs that generate kernel combinations by subtraction are represented side by side. As do Martinache & Ireland (2018), we use the example of the VLTI UT configuration observing at zenith at a wavelength of 3.6 μm. Left panel: source located at 0.2 mas from the optical axis and for which the corresponding input phase shifts are within the small phase approximation. As a result, the output intensities within each pair are fully correlated and result in no kernel signal. Center panel: source located 1.1 mas off-axis, which generates larger phase shifts. As a result, the null intensities from the enantiomorph pairs begin to decorrelate and generate kernel-null signal. Right panel: source located 4.3 mas from the optical axis, in the position where the first nulled output peaks. At this position the second output gets to zero.
Current usage metrics show cumulative count of Article Views (full-text article views including HTML views, PDF and ePub downloads, according to the available data) and Abstracts Views on Vision4Press platform.
Data correspond to usage on the plateform after 2015. The current usage metrics is available 48-96 hours after online publication and is updated daily on week days.
Initial download of the metrics may take a while.