Free Access
Fig. 8.
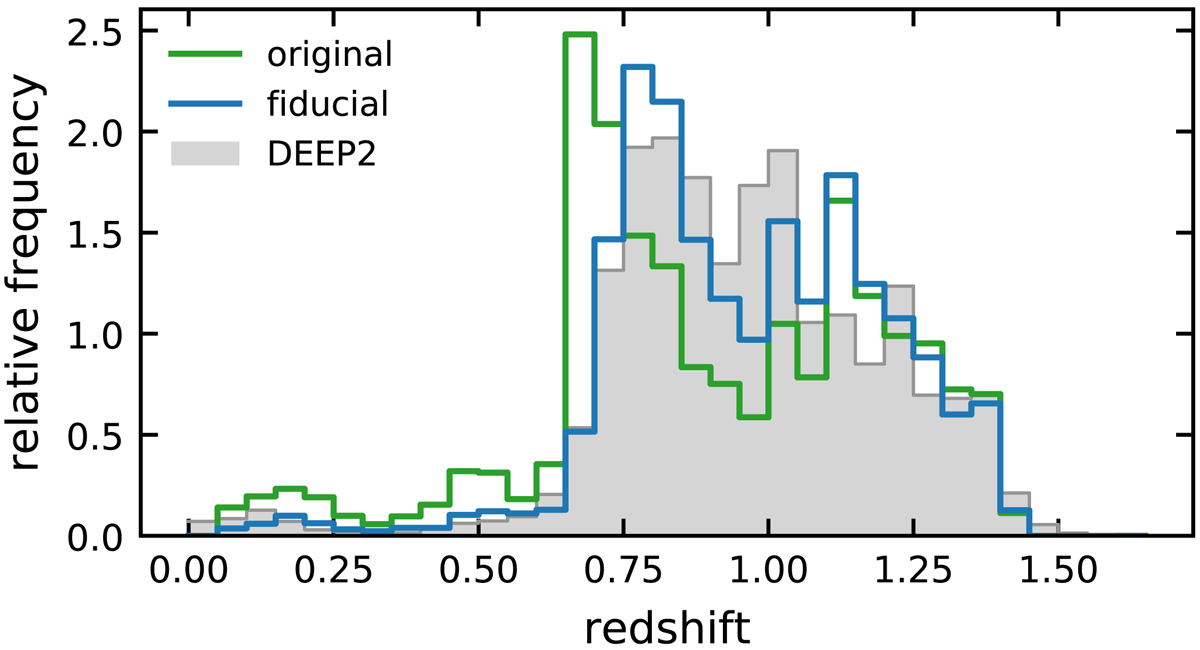
DEEP2 redshift distribution in comparison to the redshift distribution of MICE2 galaxies selected with the original colour cut (Newman et al. 2013, green) and our fiducial colour cut (blue).
Current usage metrics show cumulative count of Article Views (full-text article views including HTML views, PDF and ePub downloads, according to the available data) and Abstracts Views on Vision4Press platform.
Data correspond to usage on the plateform after 2015. The current usage metrics is available 48-96 hours after online publication and is updated daily on week days.
Initial download of the metrics may take a while.