Fig. 15.
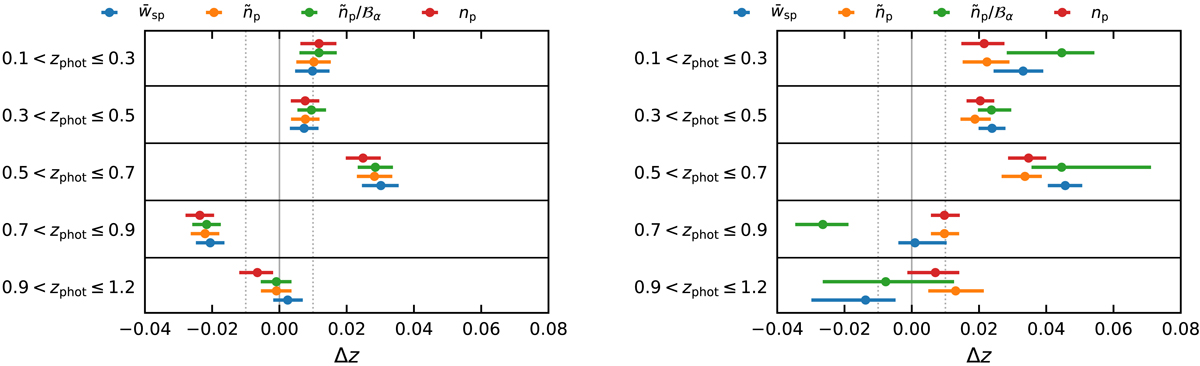
Visualisation of the shift parameters Δzi from fitting the DIR redshift distributions to the clustering redshifts obtained using the idealised (left side) and the realistic (right side) spectroscopic mock samples. The colours indicate different bias correction methods applied: the raw cross-correlation (blue), reference sample bias corrected (orange), additionally the target sample bias corrected using the SBM (green) and the target sample bias corrected using the sample autocorrelation function (red).
Current usage metrics show cumulative count of Article Views (full-text article views including HTML views, PDF and ePub downloads, according to the available data) and Abstracts Views on Vision4Press platform.
Data correspond to usage on the plateform after 2015. The current usage metrics is available 48-96 hours after online publication and is updated daily on week days.
Initial download of the metrics may take a while.