Fig. 8.
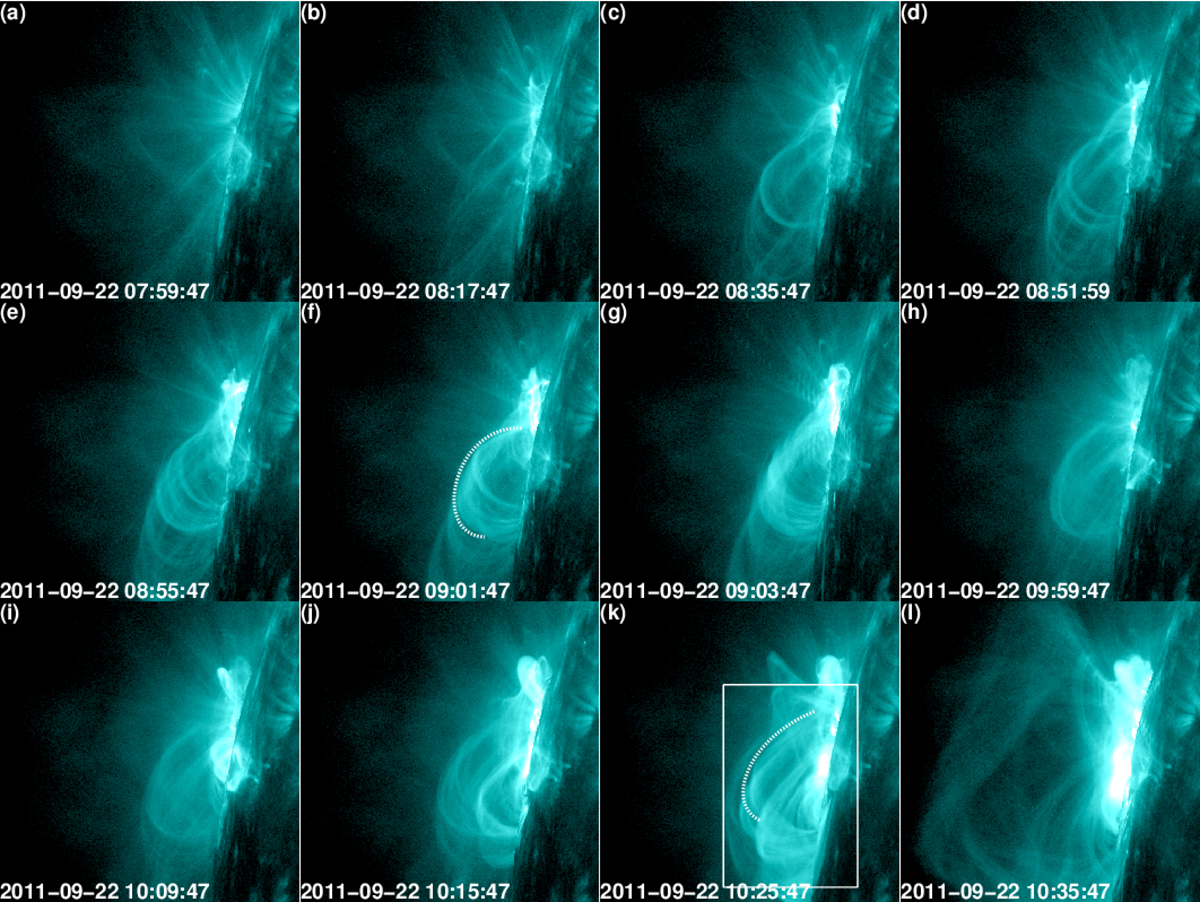
Example of the evolution, at 131 Å, of a preexisting HFR whose formation was associated with a confined flare (PREC; event 25 in Table 1). The dotted curves delineate the outer edge of the HFR. The box in panel k marks the area used for the calculations presented in Fig. 9. The field of view is 300 × 300 arcsec2. See also the associated online movie.
Current usage metrics show cumulative count of Article Views (full-text article views including HTML views, PDF and ePub downloads, according to the available data) and Abstracts Views on Vision4Press platform.
Data correspond to usage on the plateform after 2015. The current usage metrics is available 48-96 hours after online publication and is updated daily on week days.
Initial download of the metrics may take a while.