Fig. 3.
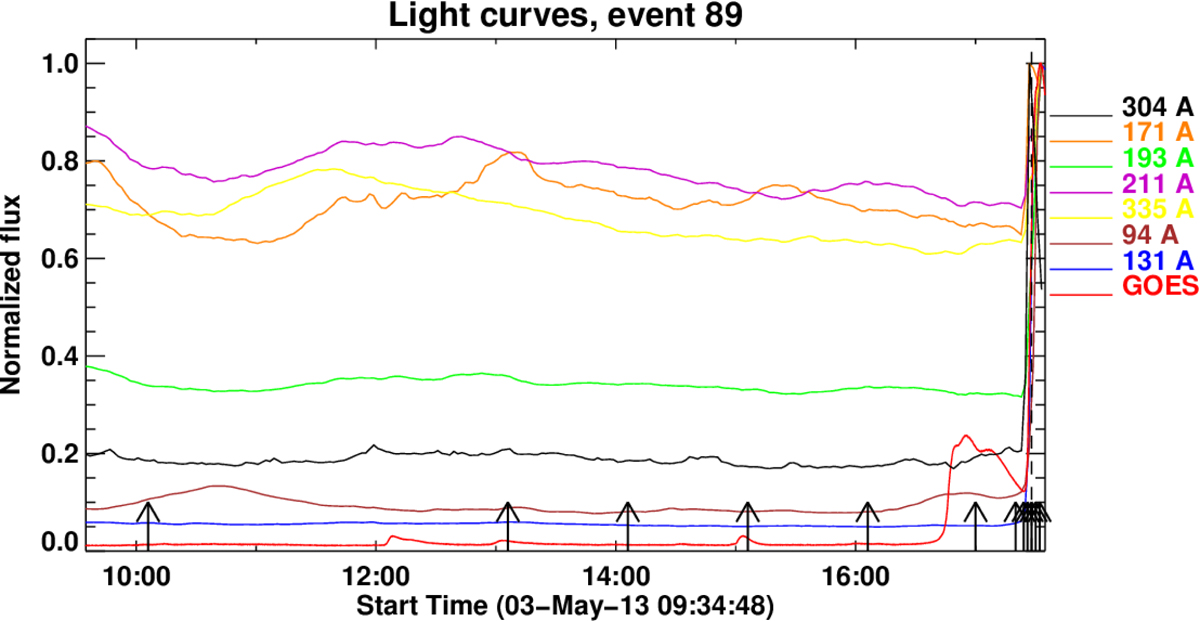
Light curves in 94, 131, 171, 193, 211, 304, and 335 Å AIA passbands from the region marked with the box shown in Fig. 2j as well as in the GOES 1–8 Å channel. All curves are normalized to their maximum values. The vertical dashed line marks the first appearance of the HFR. The arrows just above the horizontal axis mark the times of the images displayed in Fig. 2.
Current usage metrics show cumulative count of Article Views (full-text article views including HTML views, PDF and ePub downloads, according to the available data) and Abstracts Views on Vision4Press platform.
Data correspond to usage on the plateform after 2015. The current usage metrics is available 48-96 hours after online publication and is updated daily on week days.
Initial download of the metrics may take a while.