Fig. 9.
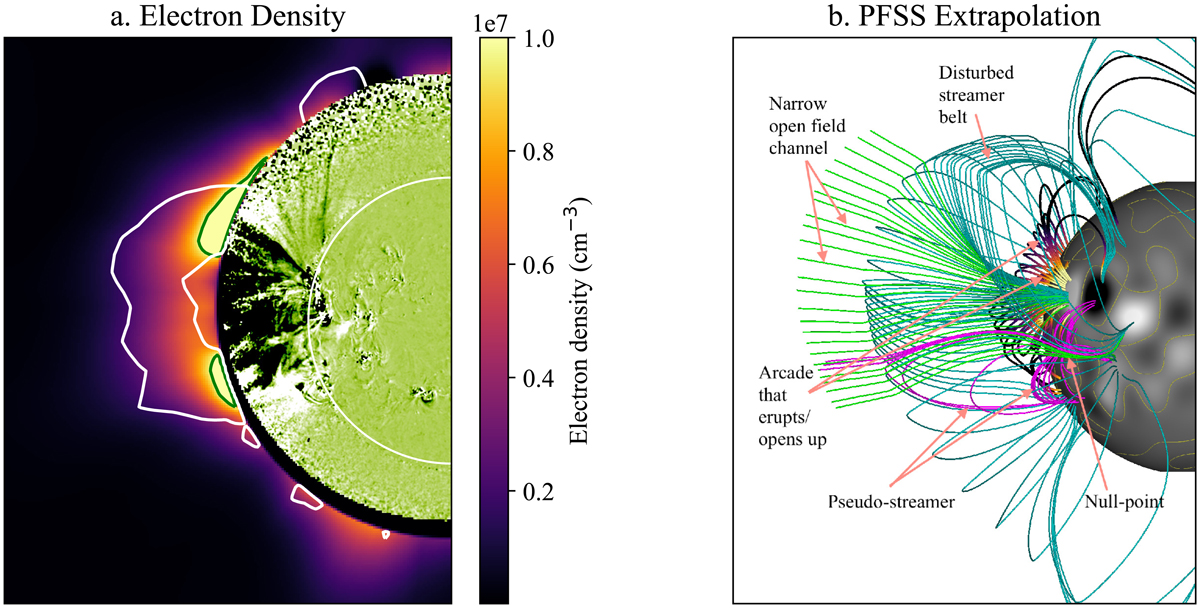
Electron density and magnetic field environment through which the CME propagates. (a) Electron density map of the solar corona from the STEREO-A perspective. The green contours represent the 107 cm−3 density level and the white contours outline the CME density structure after a background map has been subtracted. (b) PFSS extrapolation from the photospheric magnetic field showing the coronal flux systems in the vicinity of the CME source region.
Current usage metrics show cumulative count of Article Views (full-text article views including HTML views, PDF and ePub downloads, according to the available data) and Abstracts Views on Vision4Press platform.
Data correspond to usage on the plateform after 2015. The current usage metrics is available 48-96 hours after online publication and is updated daily on week days.
Initial download of the metrics may take a while.