Free Access
Fig. 7.
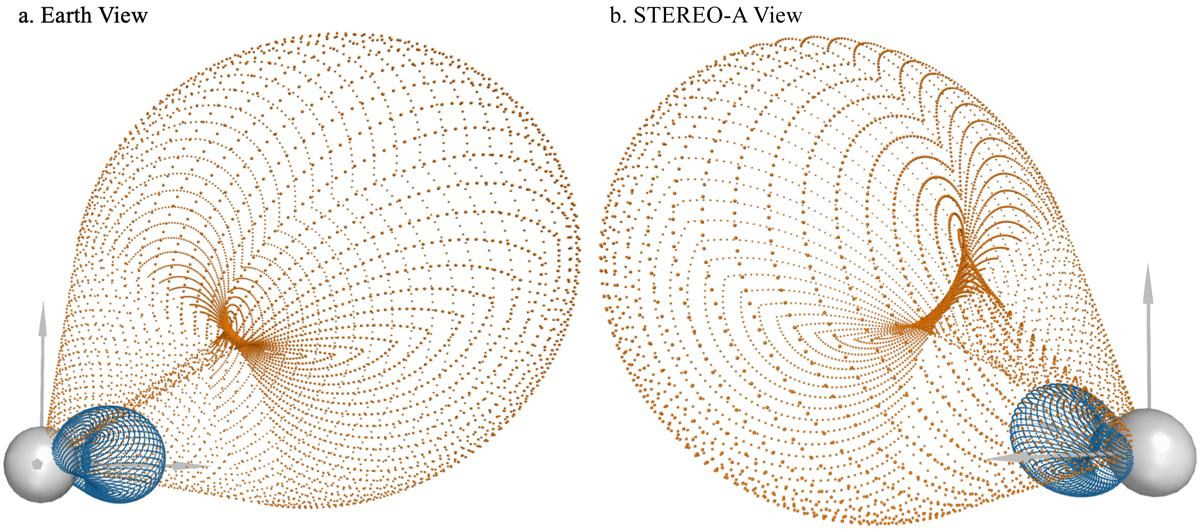
CME expansion in 3D relative to the earlier ongoing CME. The main CME is shown as a wireframe consisting of blue dots, while the ealier CME is shown as an orange wireframe. Two viewpoints are shown from (a) Earth’s perspective and (b) STEREO-A’s perspective.
Current usage metrics show cumulative count of Article Views (full-text article views including HTML views, PDF and ePub downloads, according to the available data) and Abstracts Views on Vision4Press platform.
Data correspond to usage on the plateform after 2015. The current usage metrics is available 48-96 hours after online publication and is updated daily on week days.
Initial download of the metrics may take a while.