Fig. 5.
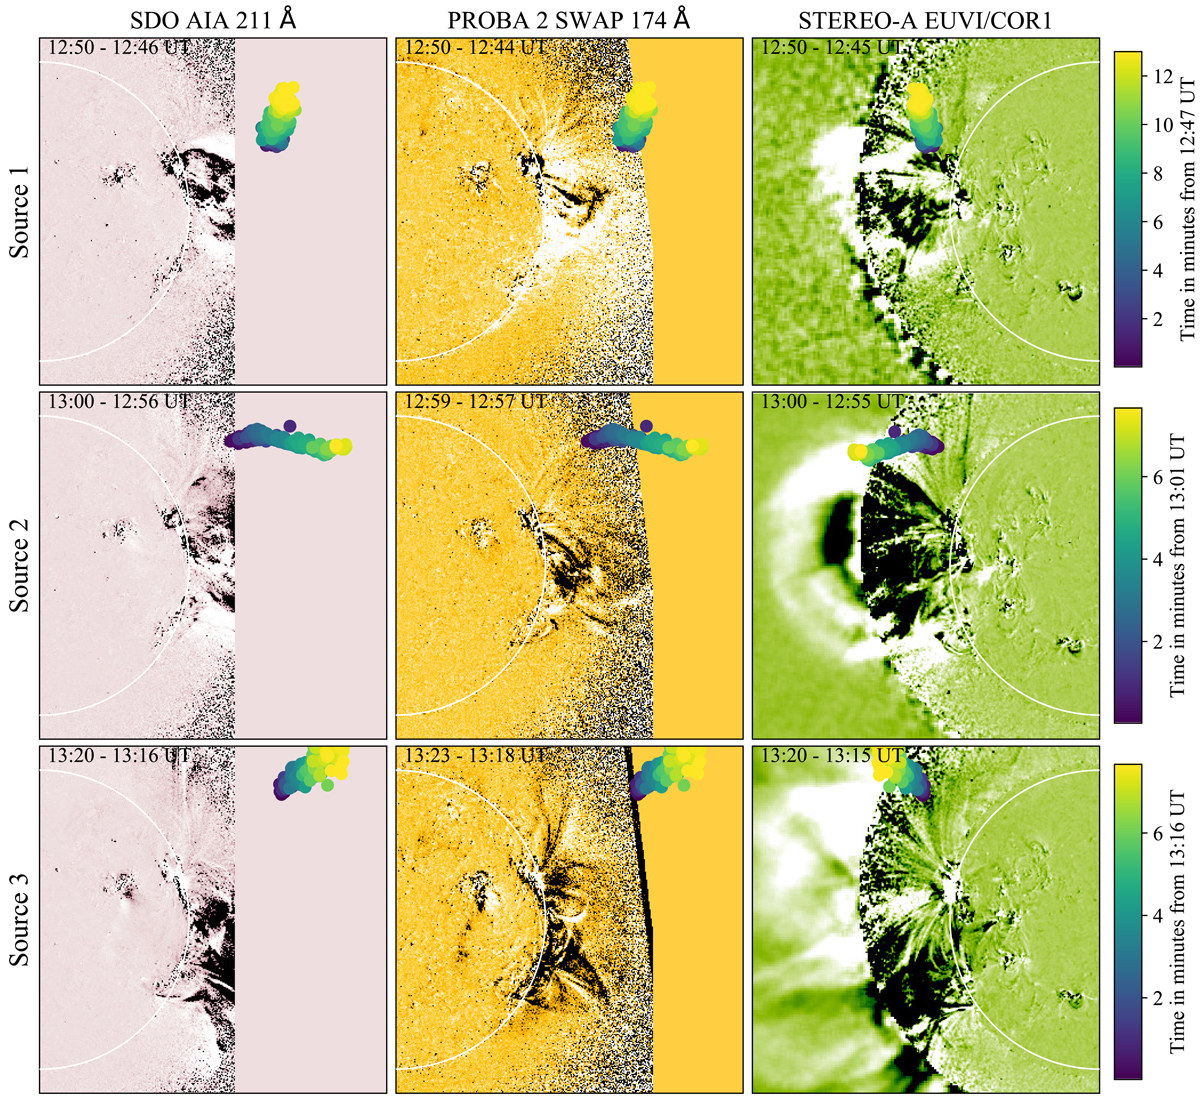
Evolution of the centroids of the moving radio sources through time. The centroids of the three moving sources are shown from top to bottom overlaid on SDO/AIA (left), PROBA2/SWAP (middle), and STEREO/EUVI-A and COR1-A (right) running-difference images of the Sun. The colour scale for the centroids represents minutes from the start time of each moving radio burst. The bursts are located at the northern CME flank in both the Earth (SDO and PROBA2) and STEREO-A perspectives.
Current usage metrics show cumulative count of Article Views (full-text article views including HTML views, PDF and ePub downloads, according to the available data) and Abstracts Views on Vision4Press platform.
Data correspond to usage on the plateform after 2015. The current usage metrics is available 48-96 hours after online publication and is updated daily on week days.
Initial download of the metrics may take a while.