Fig. A.2.
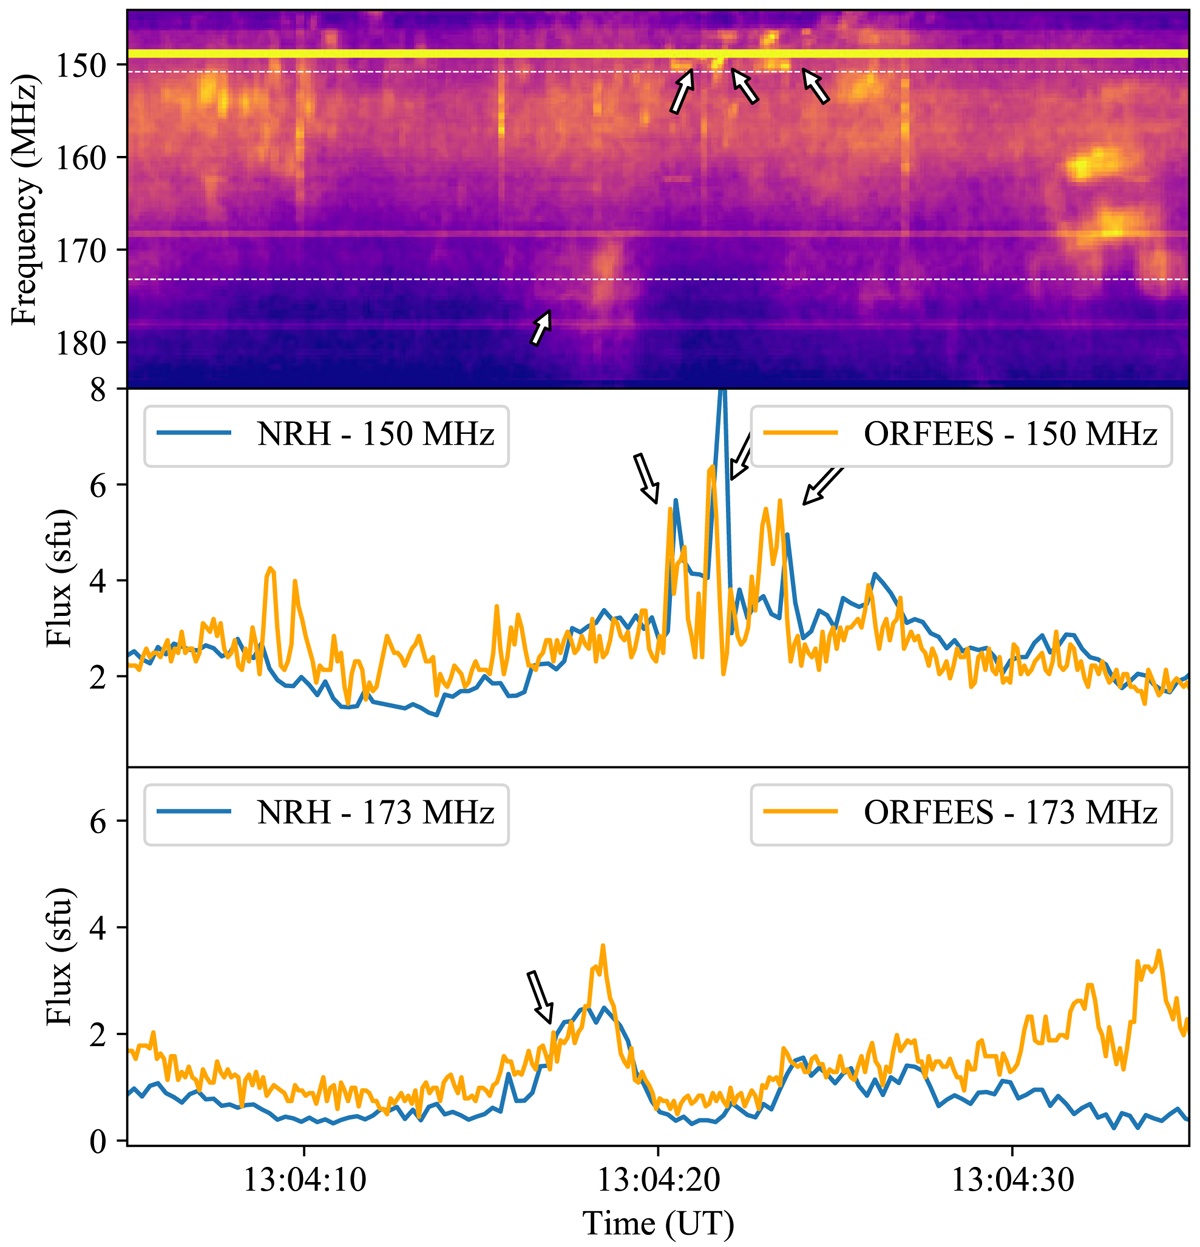
Spectral features corresponding to Source 2. (a) Zoomed-in view of the NDA dynamic spectrum showing a 30-s time period starting from 13:04:05 UT. (b) Time series of the NRH flux density of Source 2 in sfu and ORFEES normalised intensity in arbitrary units at 150.9 MHz. (c) Time series of the NRH flux density of Source 2 in sfu and ORFEES normalised intensity in arbitrary units at 150.9 MHz.
Current usage metrics show cumulative count of Article Views (full-text article views including HTML views, PDF and ePub downloads, according to the available data) and Abstracts Views on Vision4Press platform.
Data correspond to usage on the plateform after 2015. The current usage metrics is available 48-96 hours after online publication and is updated daily on week days.
Initial download of the metrics may take a while.