Fig. 3.
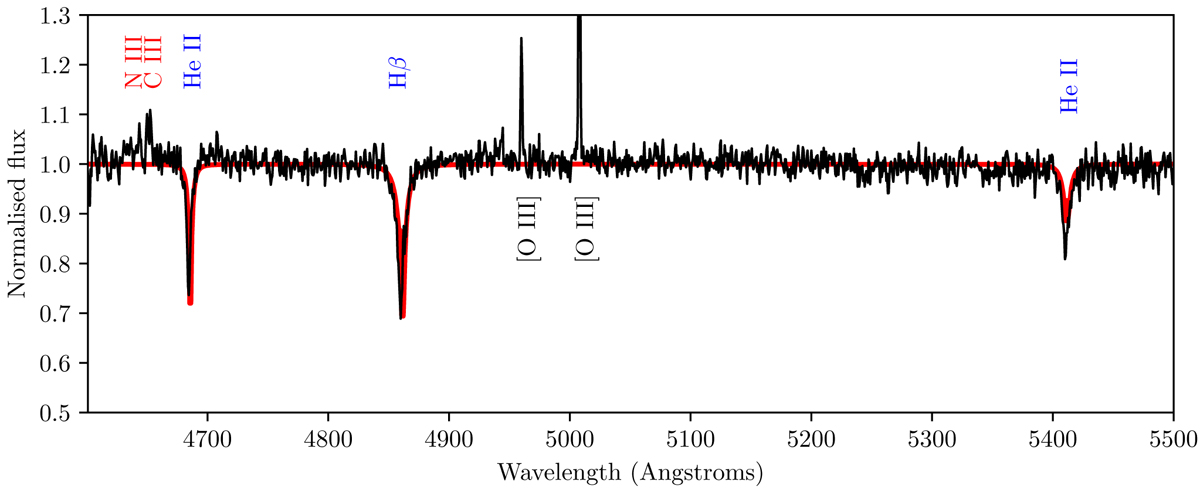
Example spectrum of the central star of PN G283.7−05.1 (in black), taken at an orbital phase of roughly 0.26. The spectrum highlights the prominent absorption spectrum of the primary as well as the extremely weak nature of the irradiated emission line complex. A TMAP synthetic spectrum with Teff and surface gravity roughly consistent with the PHOEBE2 model is underlaid in red.
Current usage metrics show cumulative count of Article Views (full-text article views including HTML views, PDF and ePub downloads, according to the available data) and Abstracts Views on Vision4Press platform.
Data correspond to usage on the plateform after 2015. The current usage metrics is available 48-96 hours after online publication and is updated daily on week days.
Initial download of the metrics may take a while.