Fig. 6
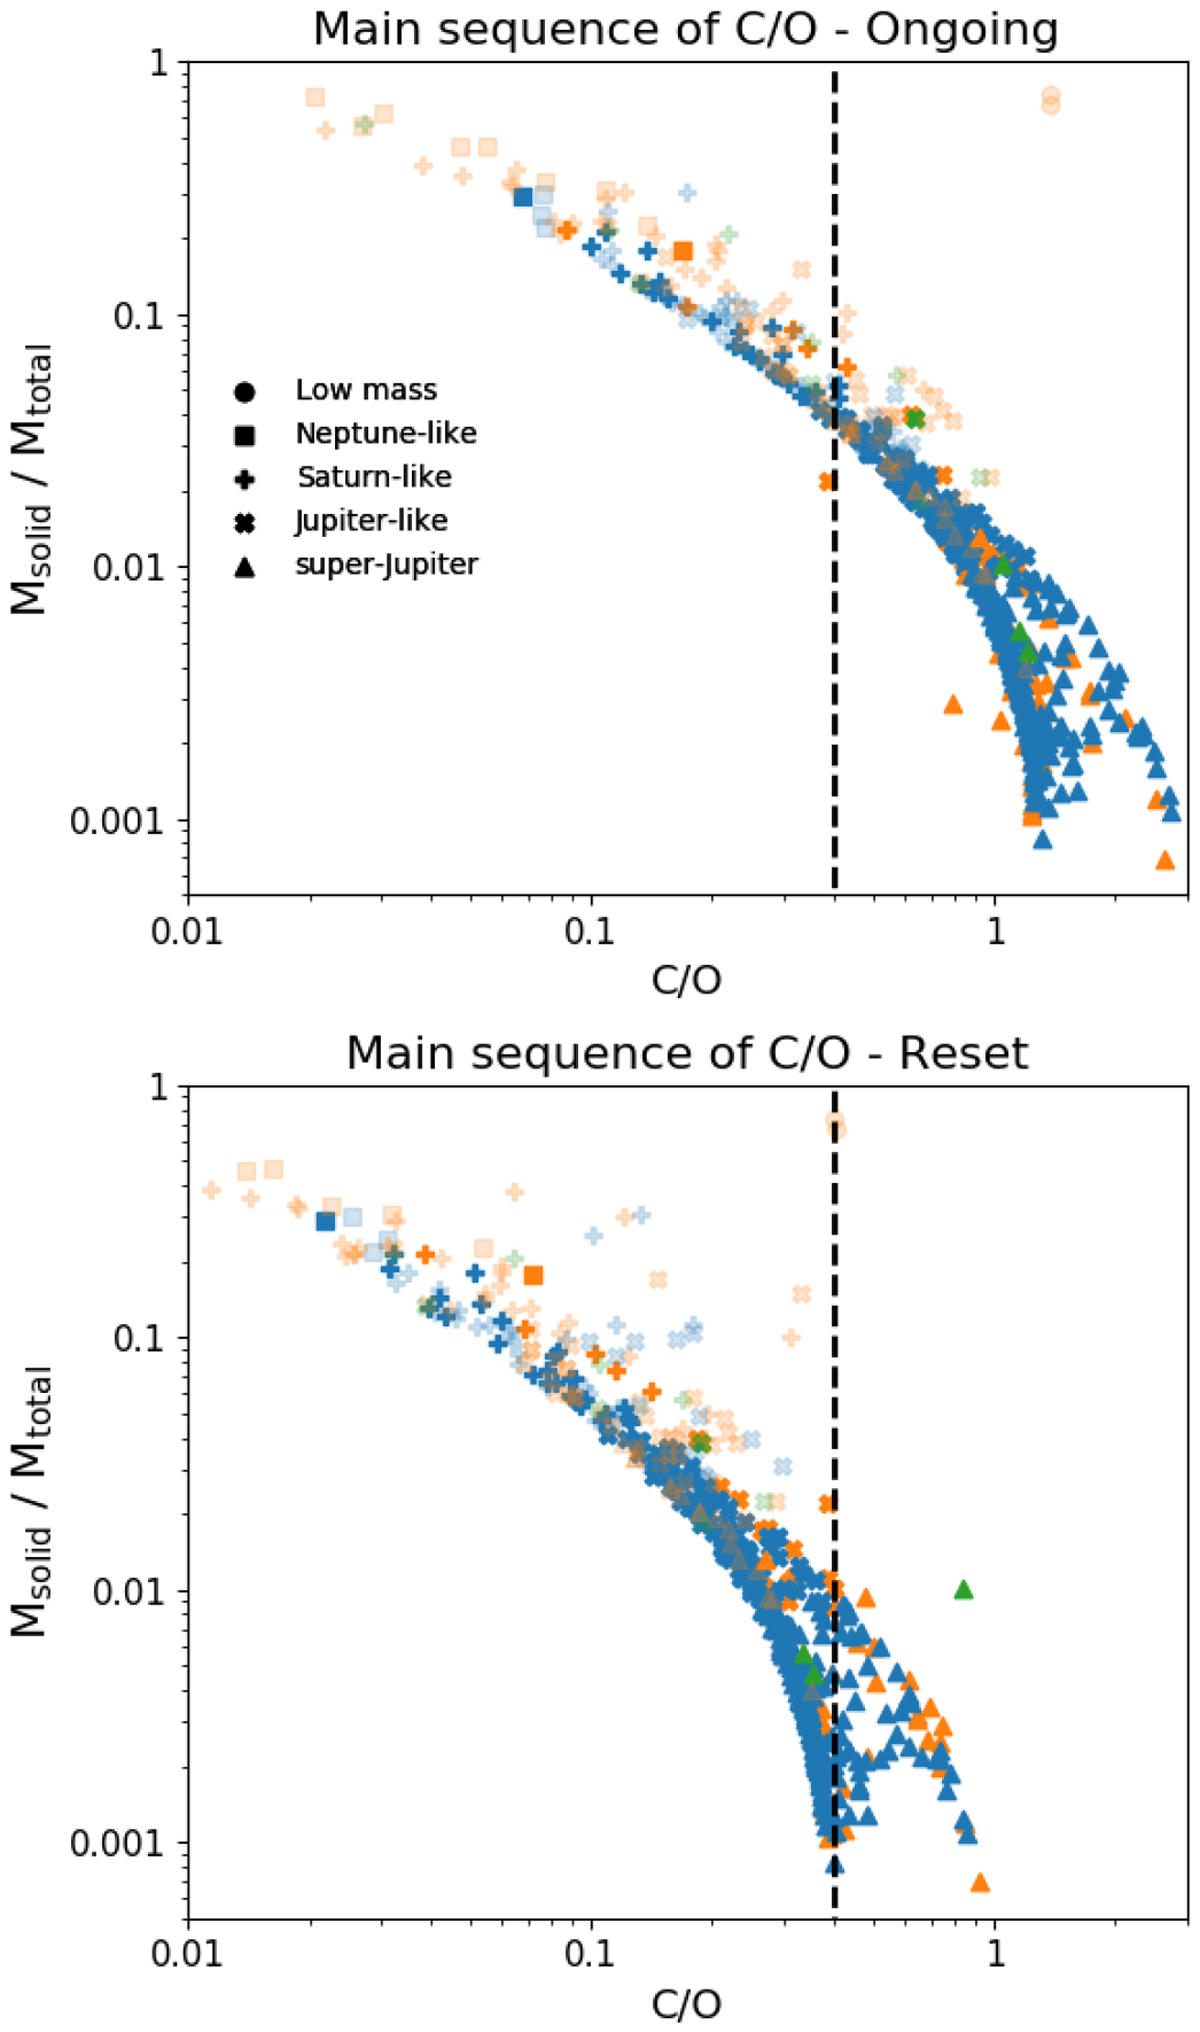
C/O main sequence for both the ongoing and reset carbon erosion models. The vertical dashed lines show the C/O = 0.4 that initialized the chemical model for the volatile component of the disk. The data from Paper I are also included as faded points to show that the population of warm Jupiters does indeed follow the general trend of the main sequence from Paper I. At the very high C/O end, the population appears to drop away from the trend found at lower C/Os. The planets in this part of the figure have very large masses and are dominated by gas accretion. The colour of each point denotes the trap from which the planet originated: ice line (blue), dead zone (orange), and heat transition (green).
Current usage metrics show cumulative count of Article Views (full-text article views including HTML views, PDF and ePub downloads, according to the available data) and Abstracts Views on Vision4Press platform.
Data correspond to usage on the plateform after 2015. The current usage metrics is available 48-96 hours after online publication and is updated daily on week days.
Initial download of the metrics may take a while.