Fig. 11
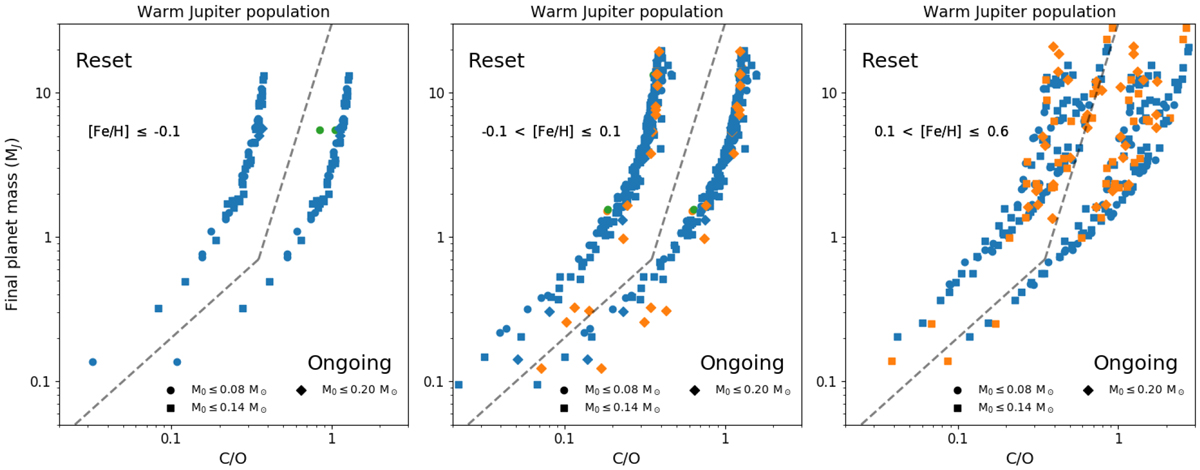
C/Os for synthetic planets in both of the ongoing and reset carbon erosion models. The data for each erosion model are separated on each panel by a dashed line. Each panel separates the planets by the proto-planetary disk metallicity. Left-hand panel: low metallicity, middle panel: solar-like metallicity (− 0.1 < [Fe/H] ≤ 0.1), and right-hand panel: high metallicity (0.1 < [Fe/H] ≤ 0.6). The different point shapes represent different initial disk masses. The colour of each point denotes the trap from which the planet originated: ice line (blue), dead zone (orange), and heat transition (green). Generally, there is a shift in the C/Os between planets growing in the reset and ongoing carbon erosion models. However, there are some exceptions: for example, the heat transition planet (green point) in the first panel has nearly the same C/O in both the reset and ongoing models (this is Planet C from above).
Current usage metrics show cumulative count of Article Views (full-text article views including HTML views, PDF and ePub downloads, according to the available data) and Abstracts Views on Vision4Press platform.
Data correspond to usage on the plateform after 2015. The current usage metrics is available 48-96 hours after online publication and is updated daily on week days.
Initial download of the metrics may take a while.