Fig. 10
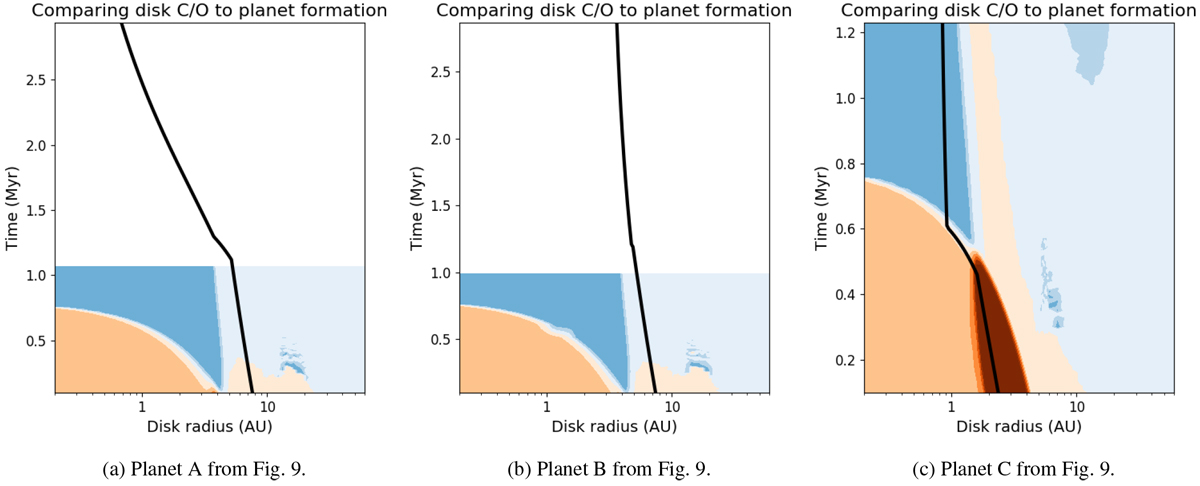
Comparison between the locations (black line) and the underlying chemical properties of the gas (coloured contours) ofPlanets A, B, and C. We note that we only show the C/O up to the point where gas accretion is shut off in our formation model since the disk no longer impacts the atmosphere once accretion is stopped. The contours are the same as in Fig. 2. We note the change in the time axis in the third panel.
Current usage metrics show cumulative count of Article Views (full-text article views including HTML views, PDF and ePub downloads, according to the available data) and Abstracts Views on Vision4Press platform.
Data correspond to usage on the plateform after 2015. The current usage metrics is available 48-96 hours after online publication and is updated daily on week days.
Initial download of the metrics may take a while.