Fig. 5.
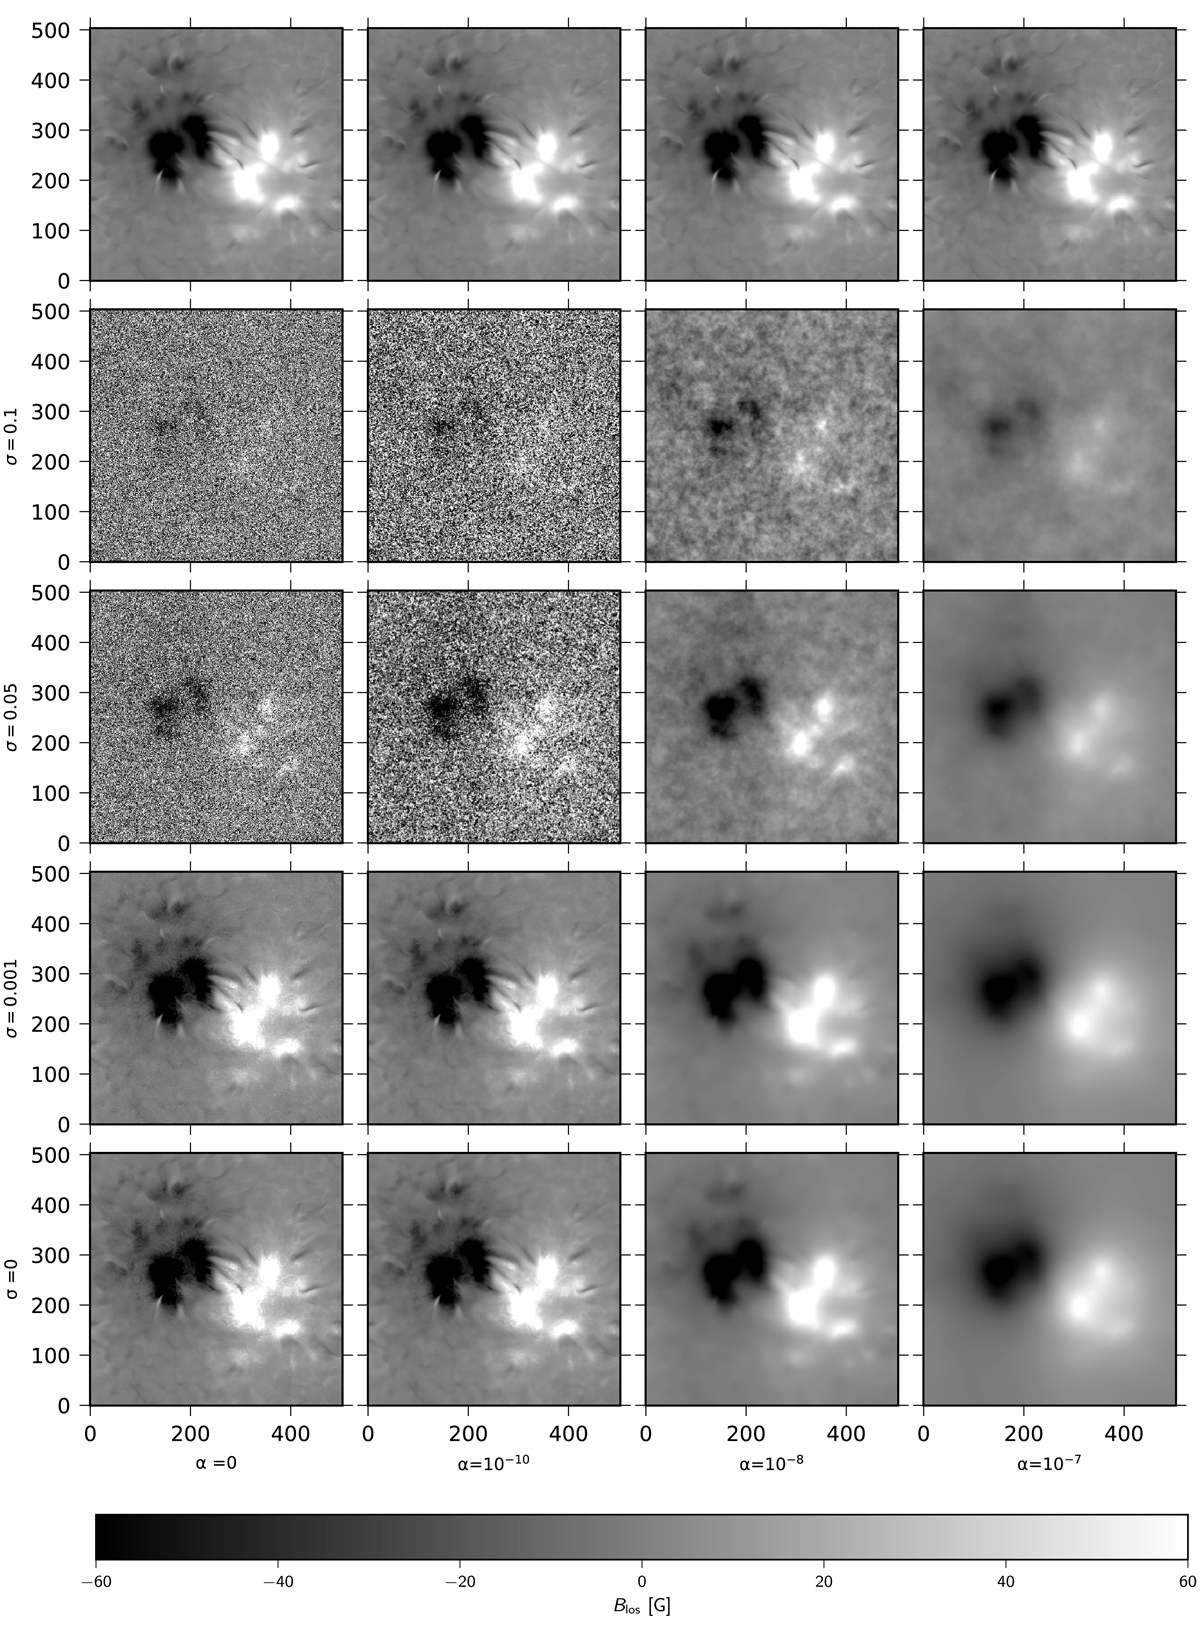
Inferred B∥ from the spatially-regularized WFA of Bifrost synthetic data for different values of noise σ and regularization parameter α. The top row shows the same B∥ map from the MHD model for reference. The remainder of the grid presents results for increased regularization parameter (from left to right) – where the first column is the equivalent of the classical WFA – and increased noise level σ (from top to bottom).
Current usage metrics show cumulative count of Article Views (full-text article views including HTML views, PDF and ePub downloads, according to the available data) and Abstracts Views on Vision4Press platform.
Data correspond to usage on the plateform after 2015. The current usage metrics is available 48-96 hours after online publication and is updated daily on week days.
Initial download of the metrics may take a while.