Fig. 3.
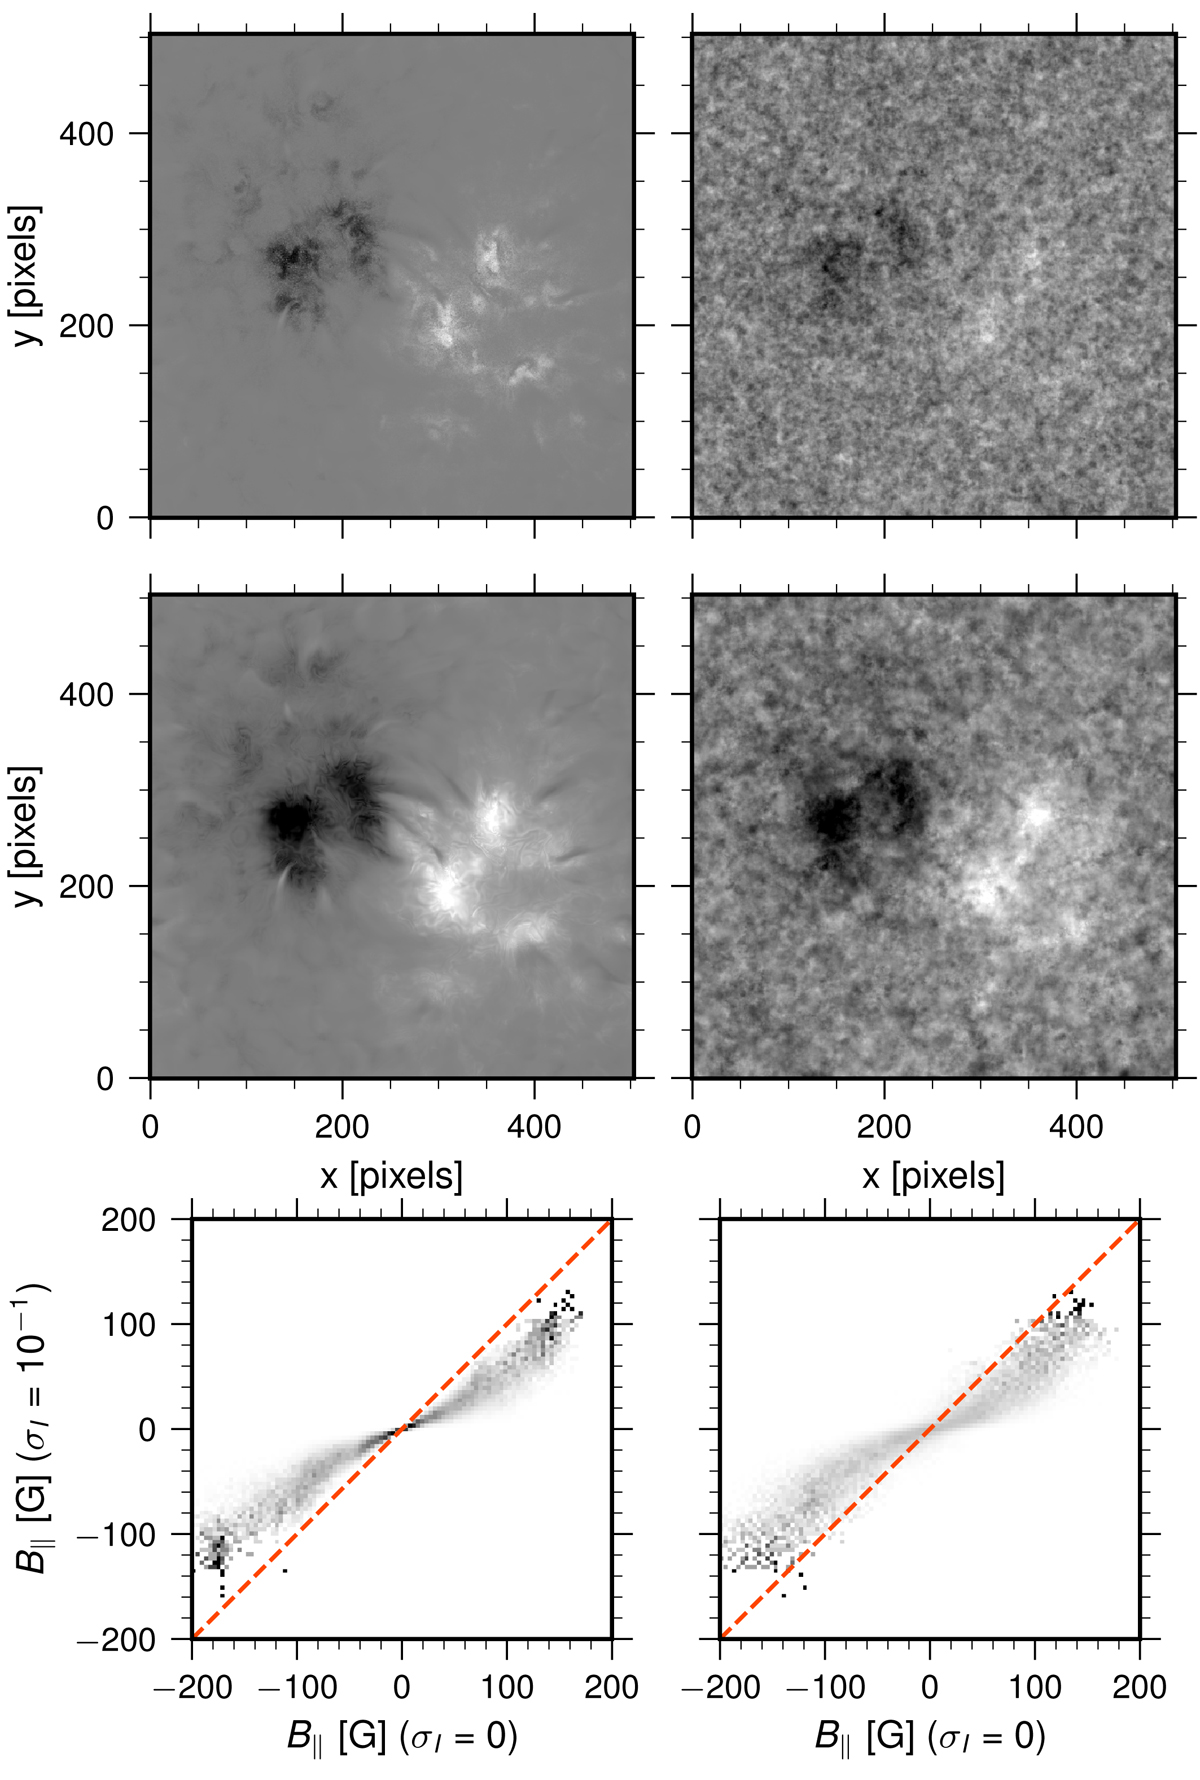
Effect of enhanced noise levels in Stokes I. Top two rows: maps of B∥ assuming σI = 10−1 (first row), σI = 0 (second row), σV = 0 (left column), and σV = 10−1 (right column). Bottom row: density plots comparing the results obtained within each column. Each row of the 2D histograms has been normalized by the value of its integral.
Current usage metrics show cumulative count of Article Views (full-text article views including HTML views, PDF and ePub downloads, according to the available data) and Abstracts Views on Vision4Press platform.
Data correspond to usage on the plateform after 2015. The current usage metrics is available 48-96 hours after online publication and is updated daily on week days.
Initial download of the metrics may take a while.