Fig. 16.
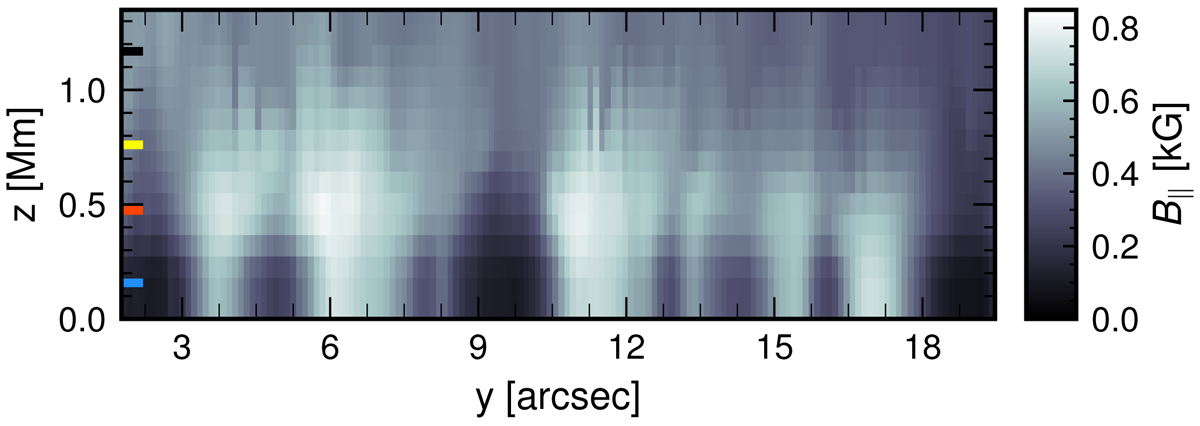
Vertical reconstruction of the canopy magnetic field from the observations. The vertical cut corresponds to the blue slit indicated in panel a of Fig. 14. The colored ticks indicate the mean formation region of each spectral region indicated in Table 1: (a) blue, (b) red, (c) yellow (d) black. The z-scale has been estimated for each pixel from its atmosphere derived from an NLTE inversion assuming hydrostatic equilibrium.
Current usage metrics show cumulative count of Article Views (full-text article views including HTML views, PDF and ePub downloads, according to the available data) and Abstracts Views on Vision4Press platform.
Data correspond to usage on the plateform after 2015. The current usage metrics is available 48-96 hours after online publication and is updated daily on week days.
Initial download of the metrics may take a while.