Fig. 14.
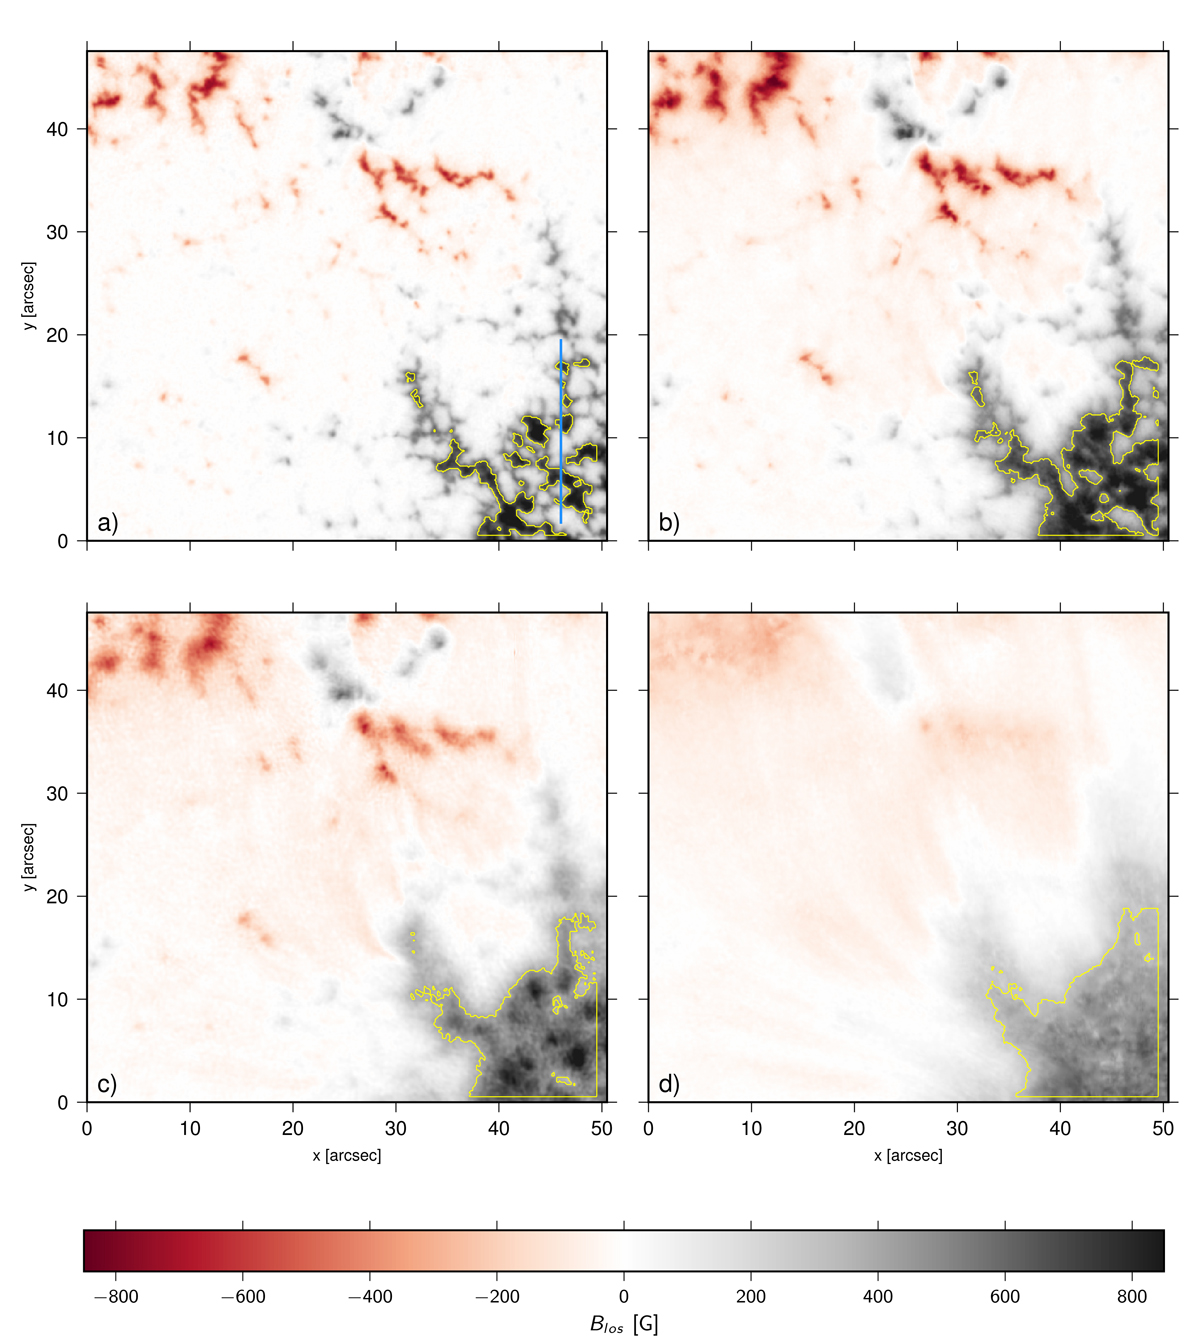
Inferred maps of B∥ from the four spectral windows summarized in Table 1. The panels are ordered according to their average formation height, as estimated using response functions. Panel a: photospheric estimate derived from the far wings of the Na I 5896 Å line. Panel b: upper photospheric estimate derived from the inner wing of the Na I 5896 Å line. Panel c: lower chromospheric estimate derived from the core of the Mg I 5173 Å line. Panel d: chromospheric estimate derived from the core of the Ca II 8542 Å line. The yellow contours indicate the area used to compute the spatial averages that are listed in the rightmost column in Table 1.
Current usage metrics show cumulative count of Article Views (full-text article views including HTML views, PDF and ePub downloads, according to the available data) and Abstracts Views on Vision4Press platform.
Data correspond to usage on the plateform after 2015. The current usage metrics is available 48-96 hours after online publication and is updated daily on week days.
Initial download of the metrics may take a while.