Fig. 4.
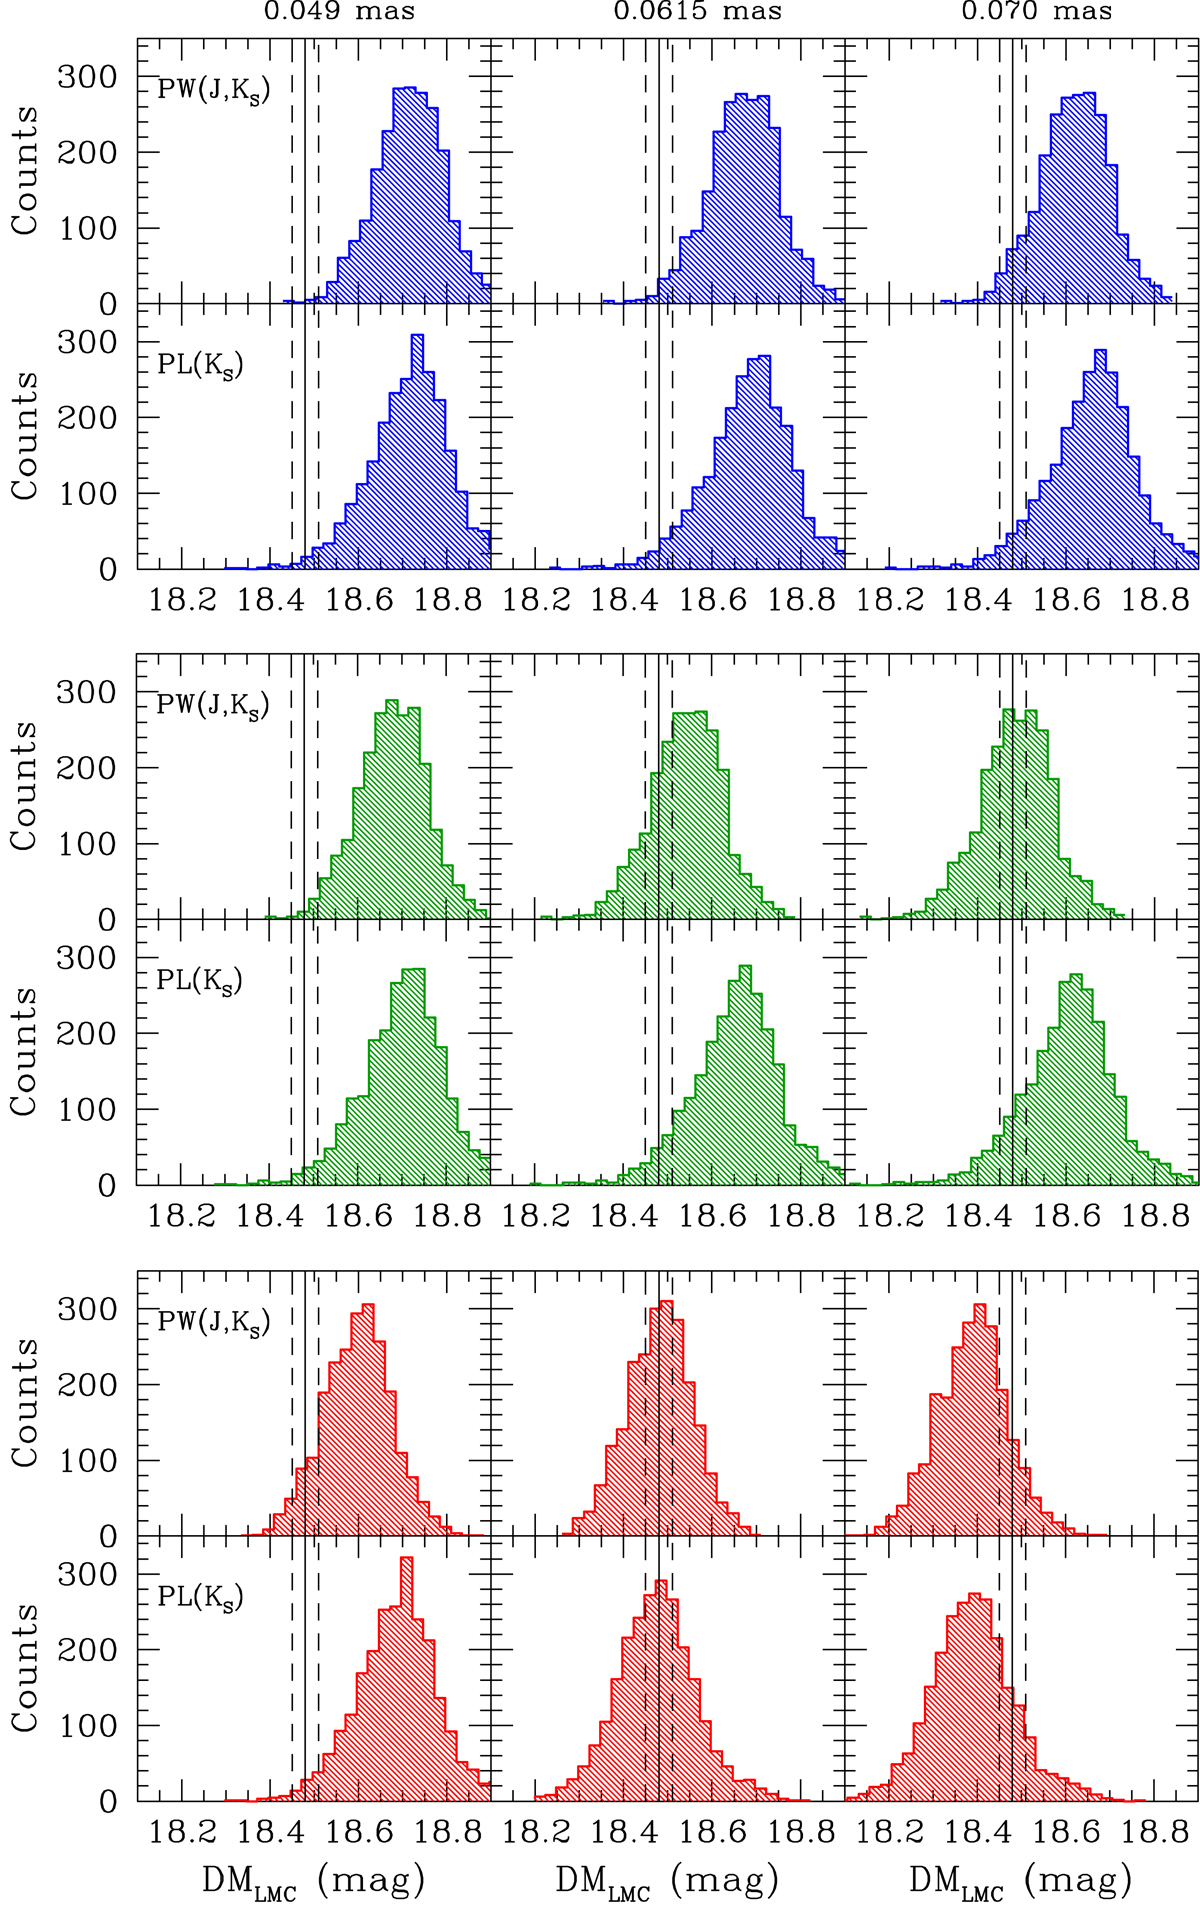
Distribution of the individual DMs for DCEP_Fs in the LMC based on distances calculated using (i) the ABL in the form of Eqs. (1) and (2) (top panels, blue histograms), (ii) the ABL in the form of Eqs. (3) and (4) (middle panels, green histograms), (iii) the ABL in the form of Eqs. (5) and (6) (bottom panels, red histograms), and the NIR photometry of the VMC survey (see text for details). From left to right: the different panels show results obtained for three different values of the Gaia parallax zero-point offset: Δϖ = 0.049, 0.0615 and 0.070 mas. The vertical solid line shows the LMC distance modulus by Pietrzyński et al. (2019); the dashed lines represent its 1σ uncertainty.
Current usage metrics show cumulative count of Article Views (full-text article views including HTML views, PDF and ePub downloads, according to the available data) and Abstracts Views on Vision4Press platform.
Data correspond to usage on the plateform after 2015. The current usage metrics is available 48-96 hours after online publication and is updated daily on week days.
Initial download of the metrics may take a while.