Fig. 9
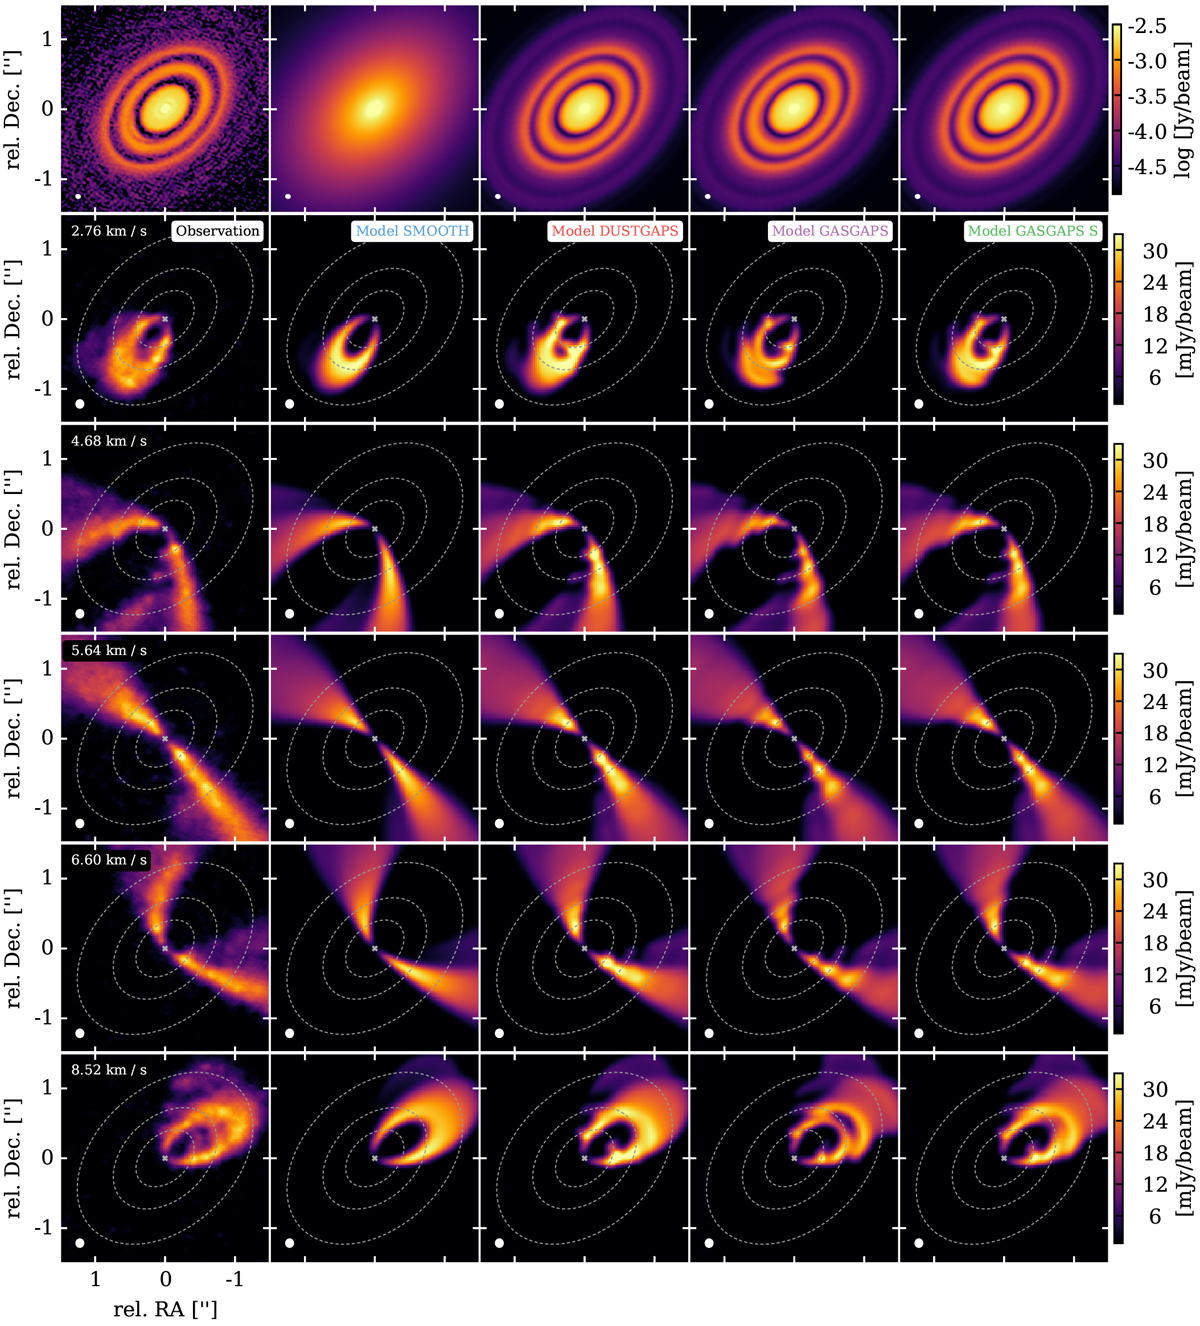
Dust continuum images and channel maps for the model series in comparison to the observations. Each row shows, from left to right, the observations, the SMOOTH, the DUSTGAPS, the GASGAPS, and the GASGAPS S model. Toprow: the dust continuum (note the logarithmic scale) is shown for comparison; five remaining rows: 12CO J = 2−1 emission for selected velocity channels. The velocity is given in the top left corner of each row. The dashed ellipses in the channel maps indicate the location of the dust gaps for reference. The filled white ellipses in the bottom left corner of each panel indicate the beam size of the observations.
Current usage metrics show cumulative count of Article Views (full-text article views including HTML views, PDF and ePub downloads, according to the available data) and Abstracts Views on Vision4Press platform.
Data correspond to usage on the plateform after 2015. The current usage metrics is available 48-96 hours after online publication and is updated daily on week days.
Initial download of the metrics may take a while.