Fig. 7
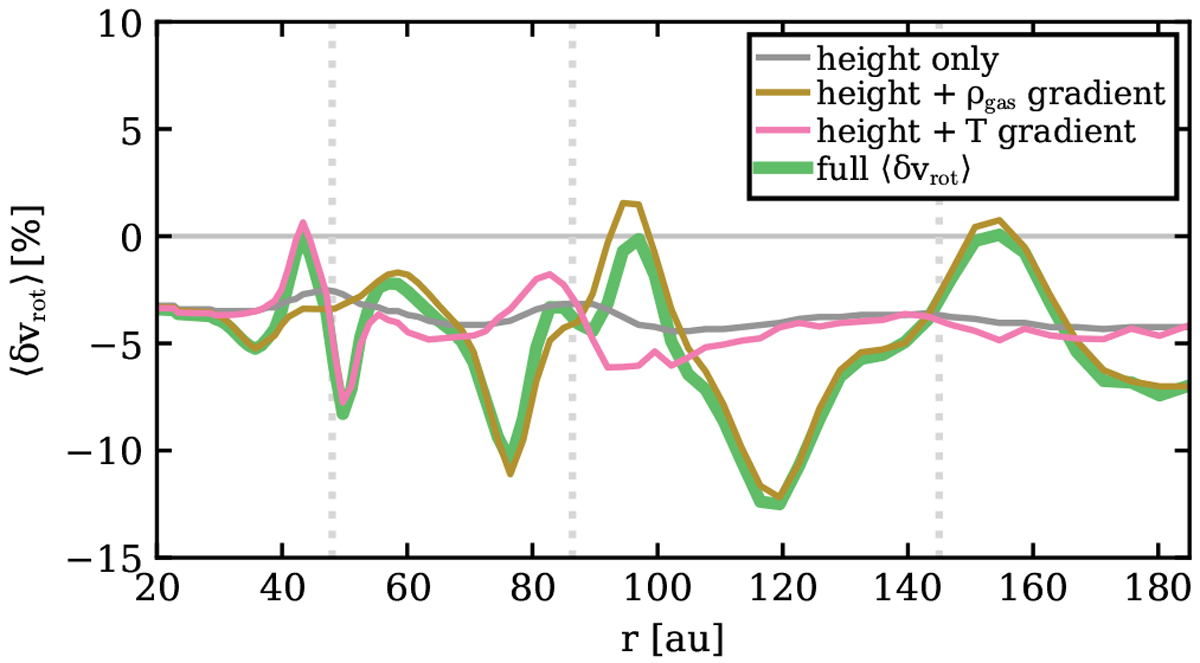
Deviations ⟨δvrot⟩ from the Keplerian velocity for the GASGAPS S model. Here we show the individual contributions to ⟨δvrot ⟩ from the height of the 12CO J = 2−1 emission layer (grey solid line), the density gradient (brown solid line), and the temperature gradient (pink solid line). The green solid line shows ⟨δvrot⟩ including allthe components (same as in the bottom panel of Fig. 6).
Current usage metrics show cumulative count of Article Views (full-text article views including HTML views, PDF and ePub downloads, according to the available data) and Abstracts Views on Vision4Press platform.
Data correspond to usage on the plateform after 2015. The current usage metrics is available 48-96 hours after online publication and is updated daily on week days.
Initial download of the metrics may take a while.