Fig. 6
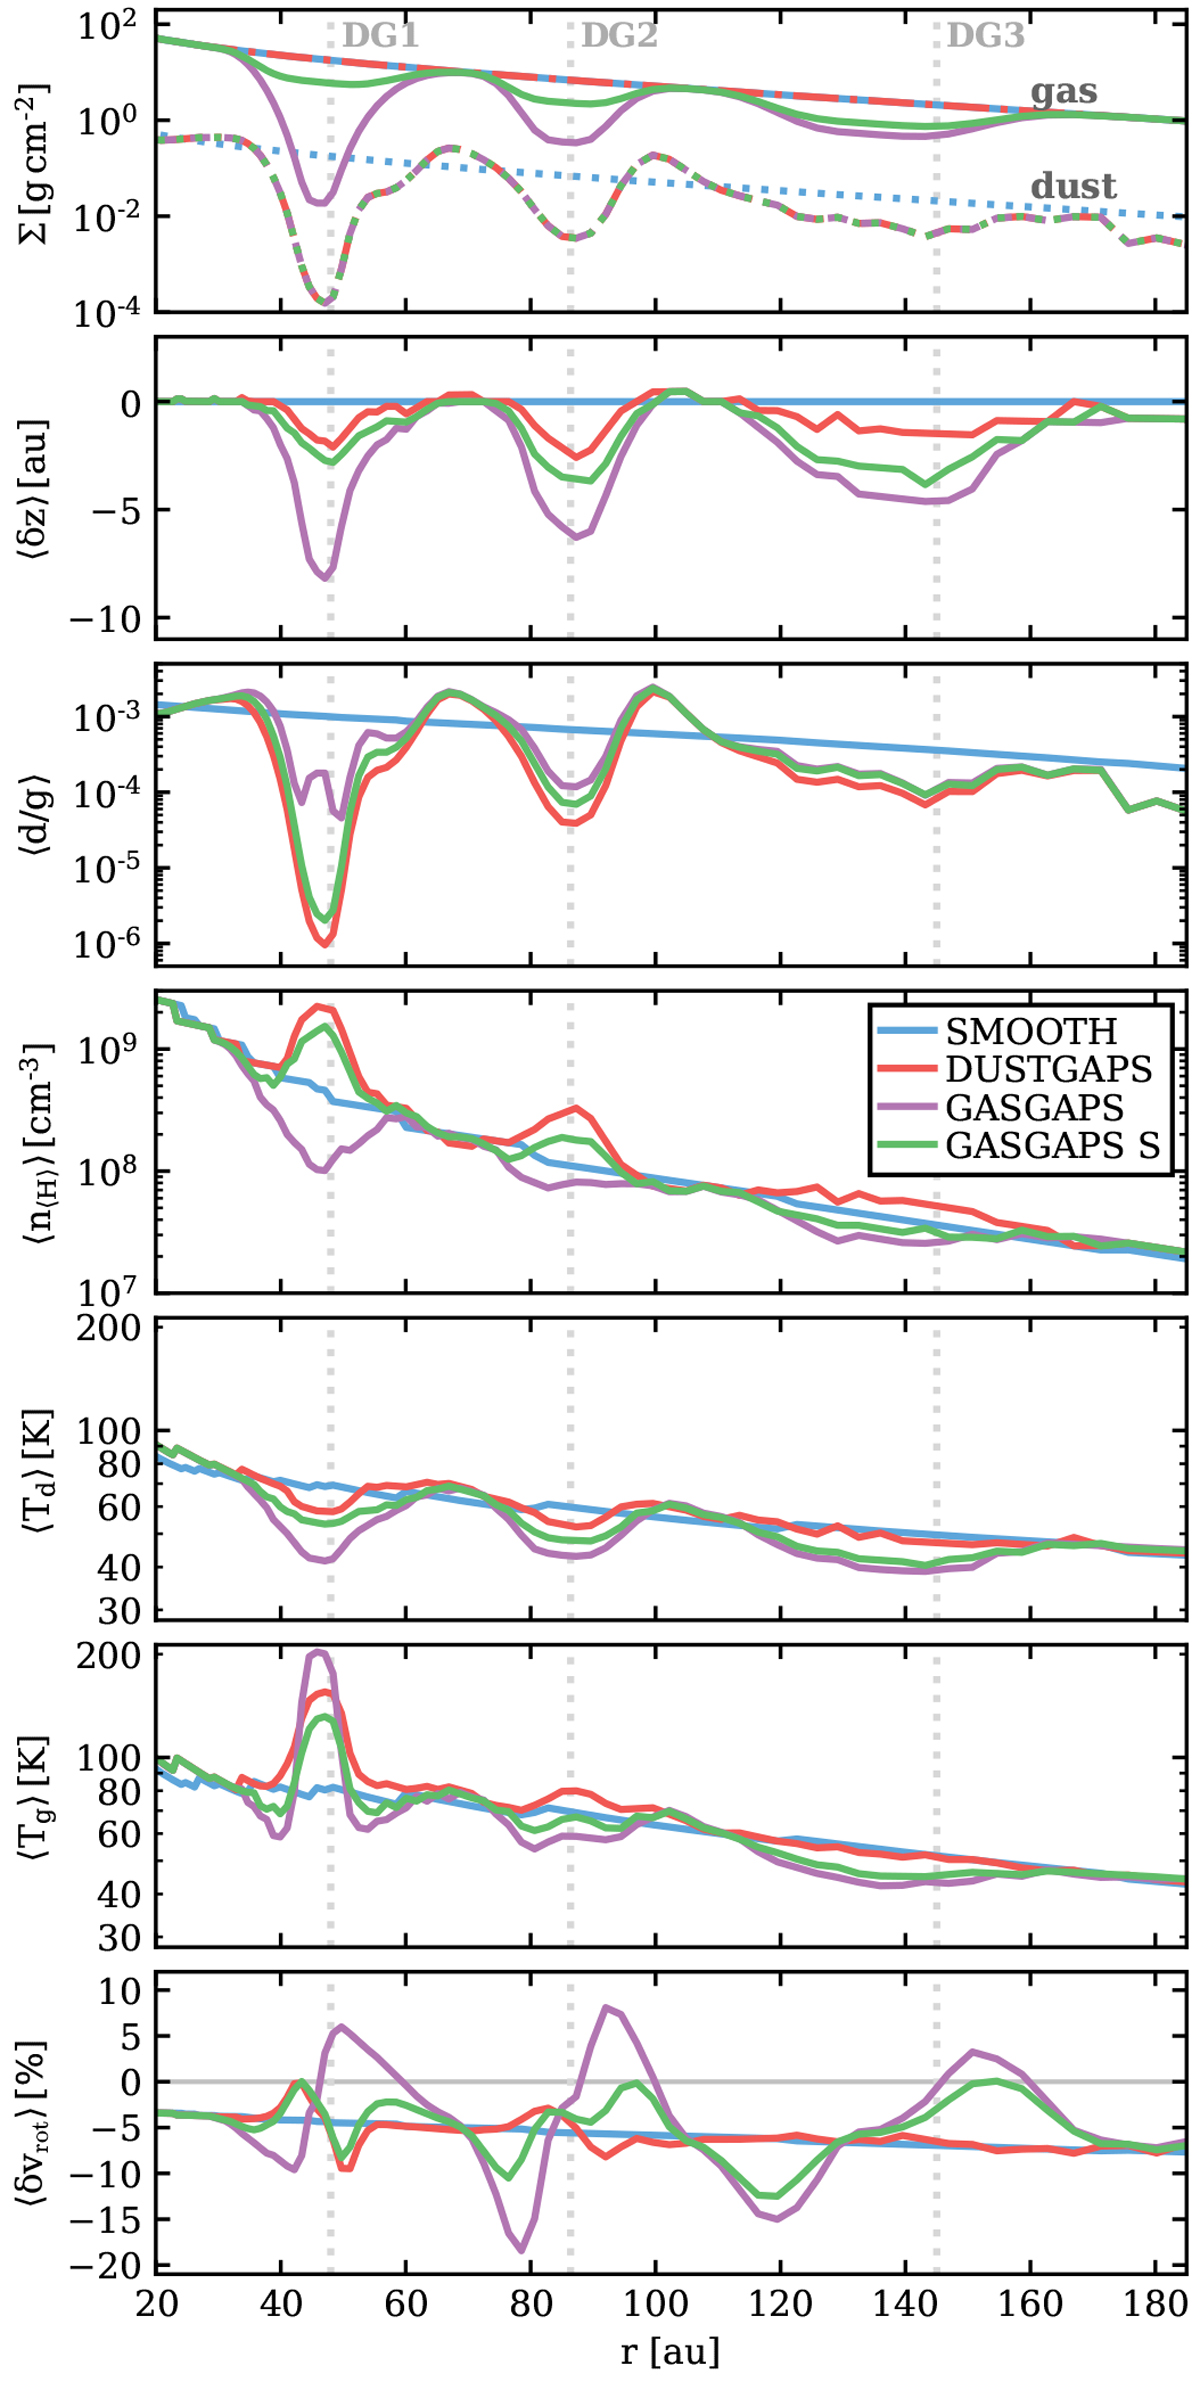
Physical properties in the line emitting region of the 12CO J = 2−1 line forthe four fiducial models (see legend). Top row: gas and dust surface densities Σ (all models with gaps have the same dust surface density profile). The other panels show quantities averaged over the line emitting region (from top to bottom): shift in the height of the line emitting region ⟨δz⟩; dust to gas mass ratio ⟨d∕g⟩; total hydrogen number density ⟨n⟨H⟩⟩; dust temperature ⟨Td⟩; gas temperature ⟨Tg⟩; and the change in the rotational velocity ⟨δvrot⟩ (see Eq. (3)). The vertical dotted lines indicate the locations of the dust gaps DG1, DG2, and DG2.
Current usage metrics show cumulative count of Article Views (full-text article views including HTML views, PDF and ePub downloads, according to the available data) and Abstracts Views on Vision4Press platform.
Data correspond to usage on the plateform after 2015. The current usage metrics is available 48-96 hours after online publication and is updated daily on week days.
Initial download of the metrics may take a while.