Fig. 4
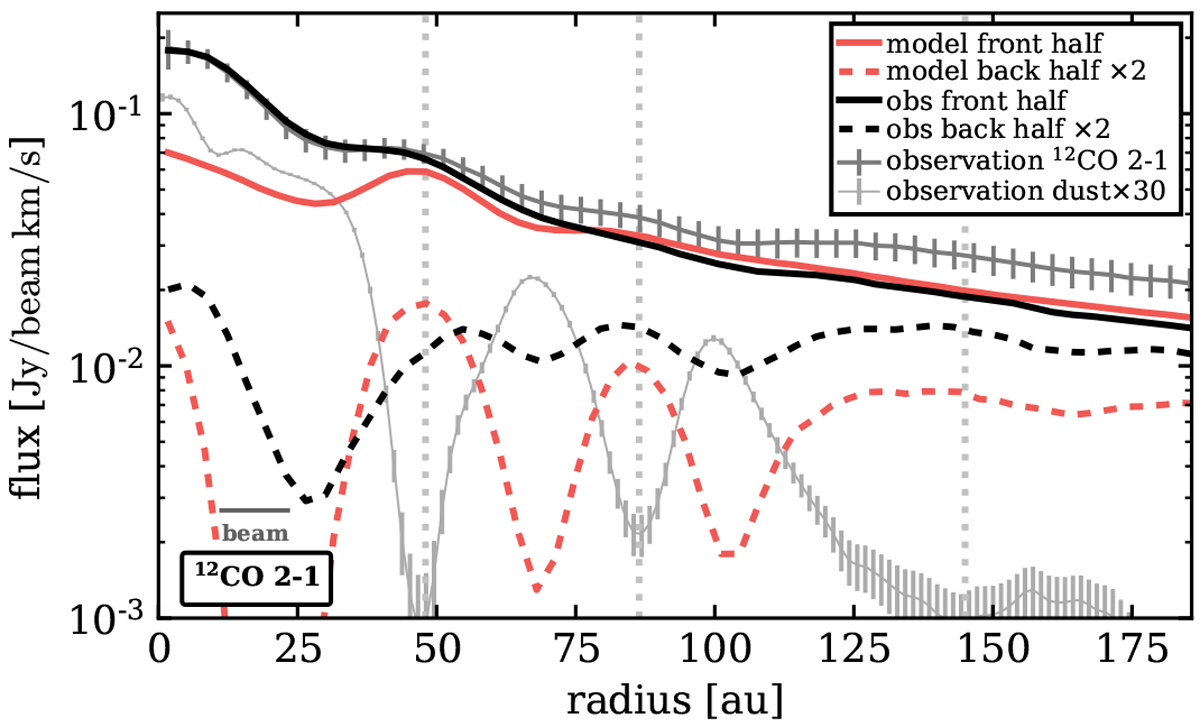
Radial intensity profiles for the 12CO J = 2−1 line shown separately for the front and back side of the disk. The solid and dashed black lines show the profiles for the front and back side of the disk for the observations. The solid and dashed red lines are the front and back side profiles derived from the DUSTGAPS model. The grey solid and dashed lines with error bars show the observed full (i.e. both sides) radialprofiles for the gas and dust, respectively, for reference. For easier comparison we multiplied the dust radial profile by a factor of 30 and the profiles for the back side of the disk by a factor of two.
Current usage metrics show cumulative count of Article Views (full-text article views including HTML views, PDF and ePub downloads, according to the available data) and Abstracts Views on Vision4Press platform.
Data correspond to usage on the plateform after 2015. The current usage metrics is available 48-96 hours after online publication and is updated daily on week days.
Initial download of the metrics may take a while.