Fig. 2
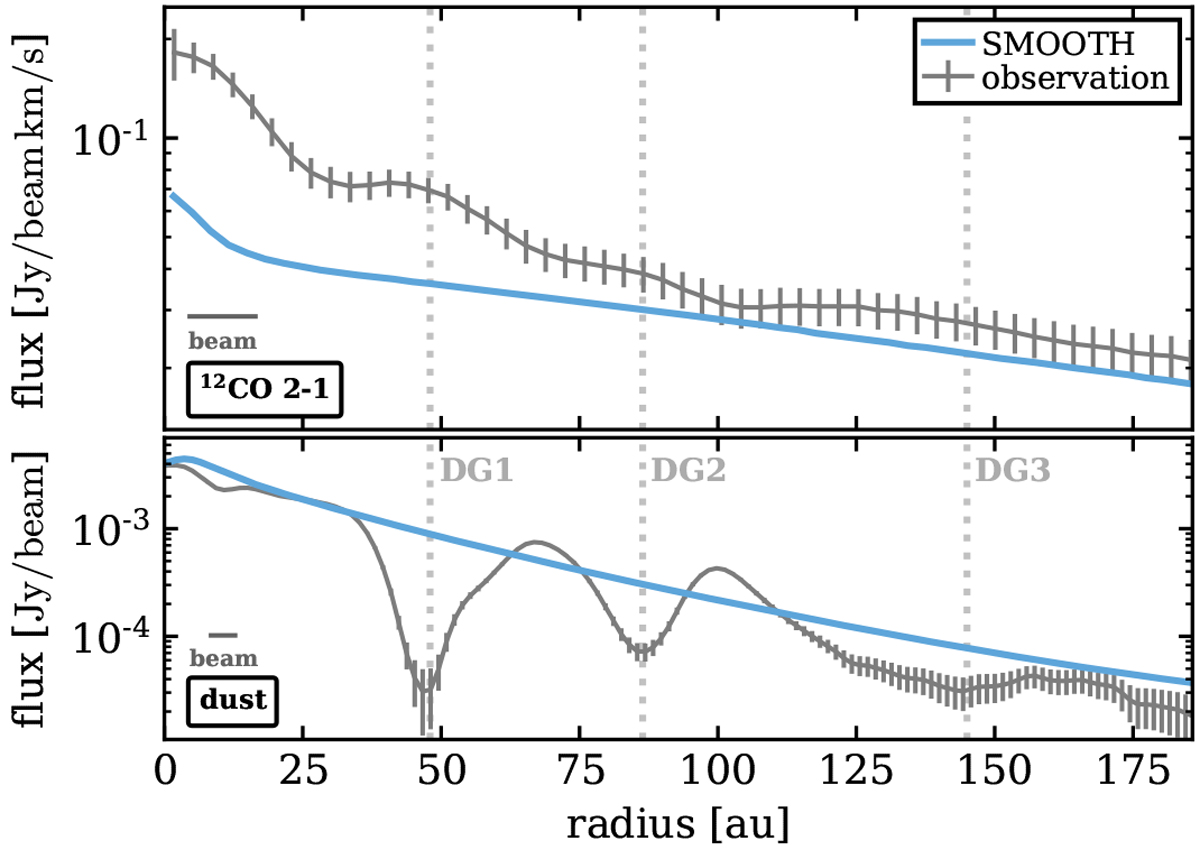
Azimuthally averaged radial intensity profiles for the 12CO J = 2−1 line emission (top panel) and the 1.25 mm dust continuum emission (bottom panel). The grey solid lines with error bars show the observations. The blue solid lines show the SMOOTH model. Bottom left of each panel: we show the full-width at half-maximum (FWHM) of the beam for the gas and continuum observations, respectively. The vertical dotted grey lines indicate the location of the three prominent dust gaps.
Current usage metrics show cumulative count of Article Views (full-text article views including HTML views, PDF and ePub downloads, according to the available data) and Abstracts Views on Vision4Press platform.
Data correspond to usage on the plateform after 2015. The current usage metrics is available 48-96 hours after online publication and is updated daily on week days.
Initial download of the metrics may take a while.