Fig. A.1
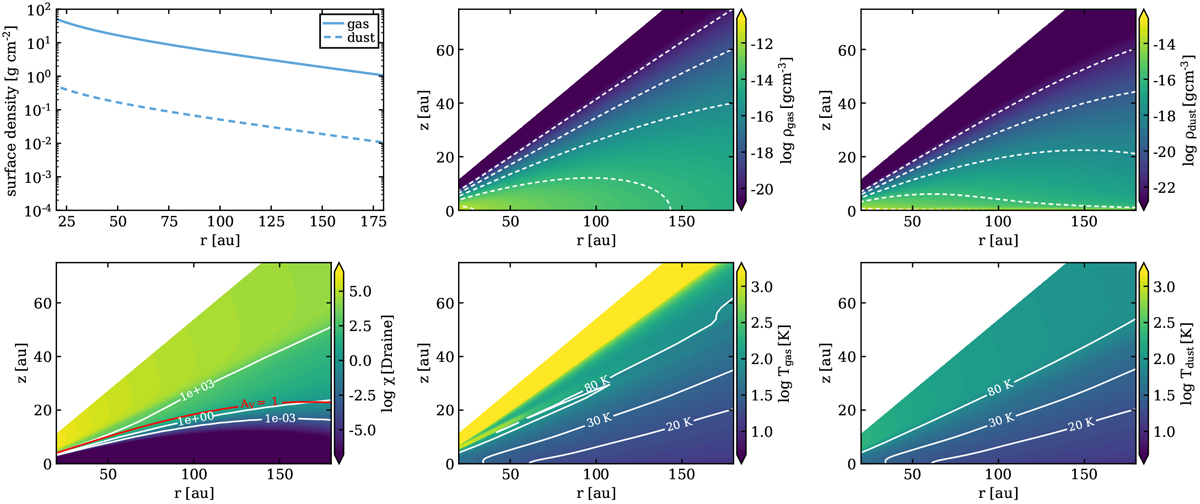
Two-dimensional disk structure for the SMOOTH model. From top left to bottom right: surface densities, gas density ρgas, dust density (ρdust), far-UV radiation field (χ), gas temperature (Tgas), and dust temperature (Tdust). The 2D contour plots only show the region from r = 20 to r = 180 au, to clearly show the physical properties within the prominent dust gaps (e.g. Fig. A.2). The contour lines in the plots for the gas and dust density correspond to the values indicated in the colour bar. The red contour line in the radiation field plot (first column bottom row) indicates a visual extinction of unity.
Current usage metrics show cumulative count of Article Views (full-text article views including HTML views, PDF and ePub downloads, according to the available data) and Abstracts Views on Vision4Press platform.
Data correspond to usage on the plateform after 2015. The current usage metrics is available 48-96 hours after online publication and is updated daily on week days.
Initial download of the metrics may take a while.