Free Access
Fig. 5.
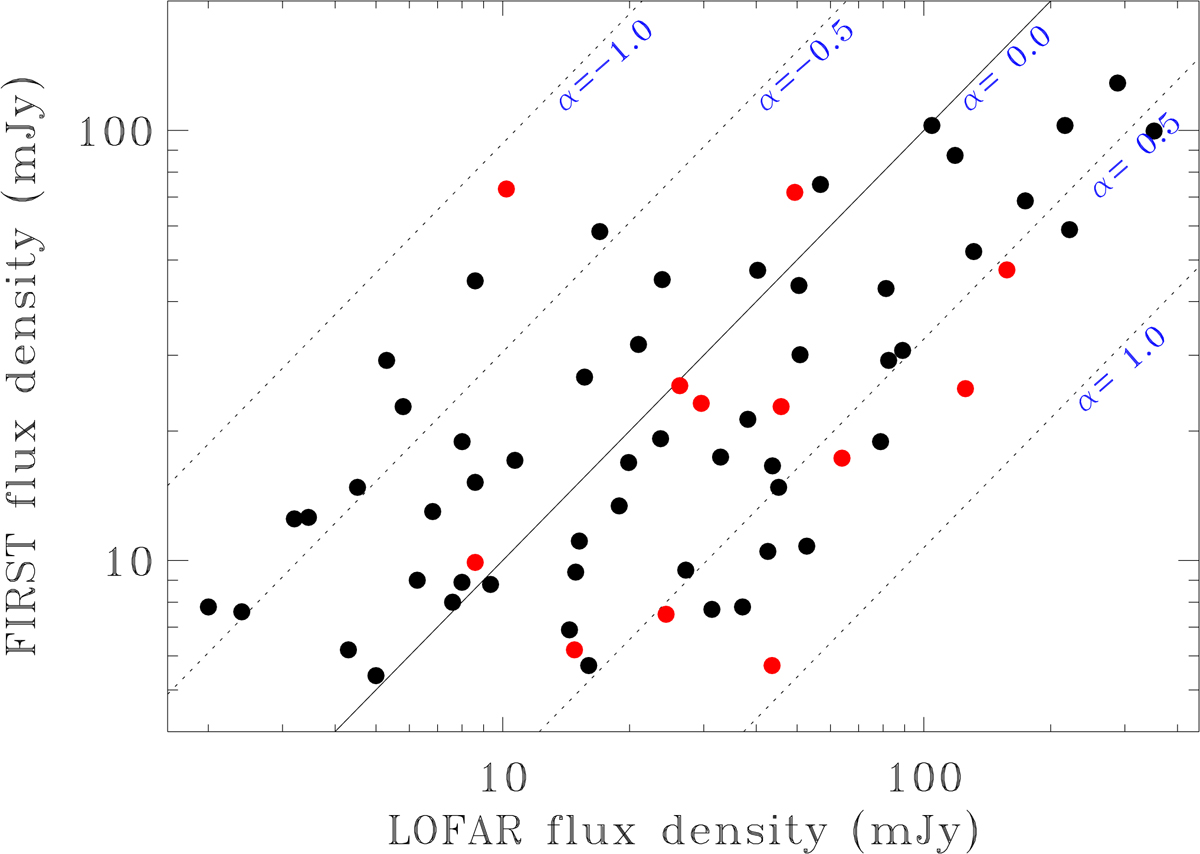
Comparison of the flux densities of the compact components of the FR0CAT sources in LOFAR (at 150 MHz) and FIRST (at 1.4 GHz). The red dots represent the 12 sources extended in the LOFAR images. The lines are the loci of constant spectral indices α (defined as Fν ∝ ν−α) at the values indicated.
Current usage metrics show cumulative count of Article Views (full-text article views including HTML views, PDF and ePub downloads, according to the available data) and Abstracts Views on Vision4Press platform.
Data correspond to usage on the plateform after 2015. The current usage metrics is available 48-96 hours after online publication and is updated daily on week days.
Initial download of the metrics may take a while.