Fig. 9.
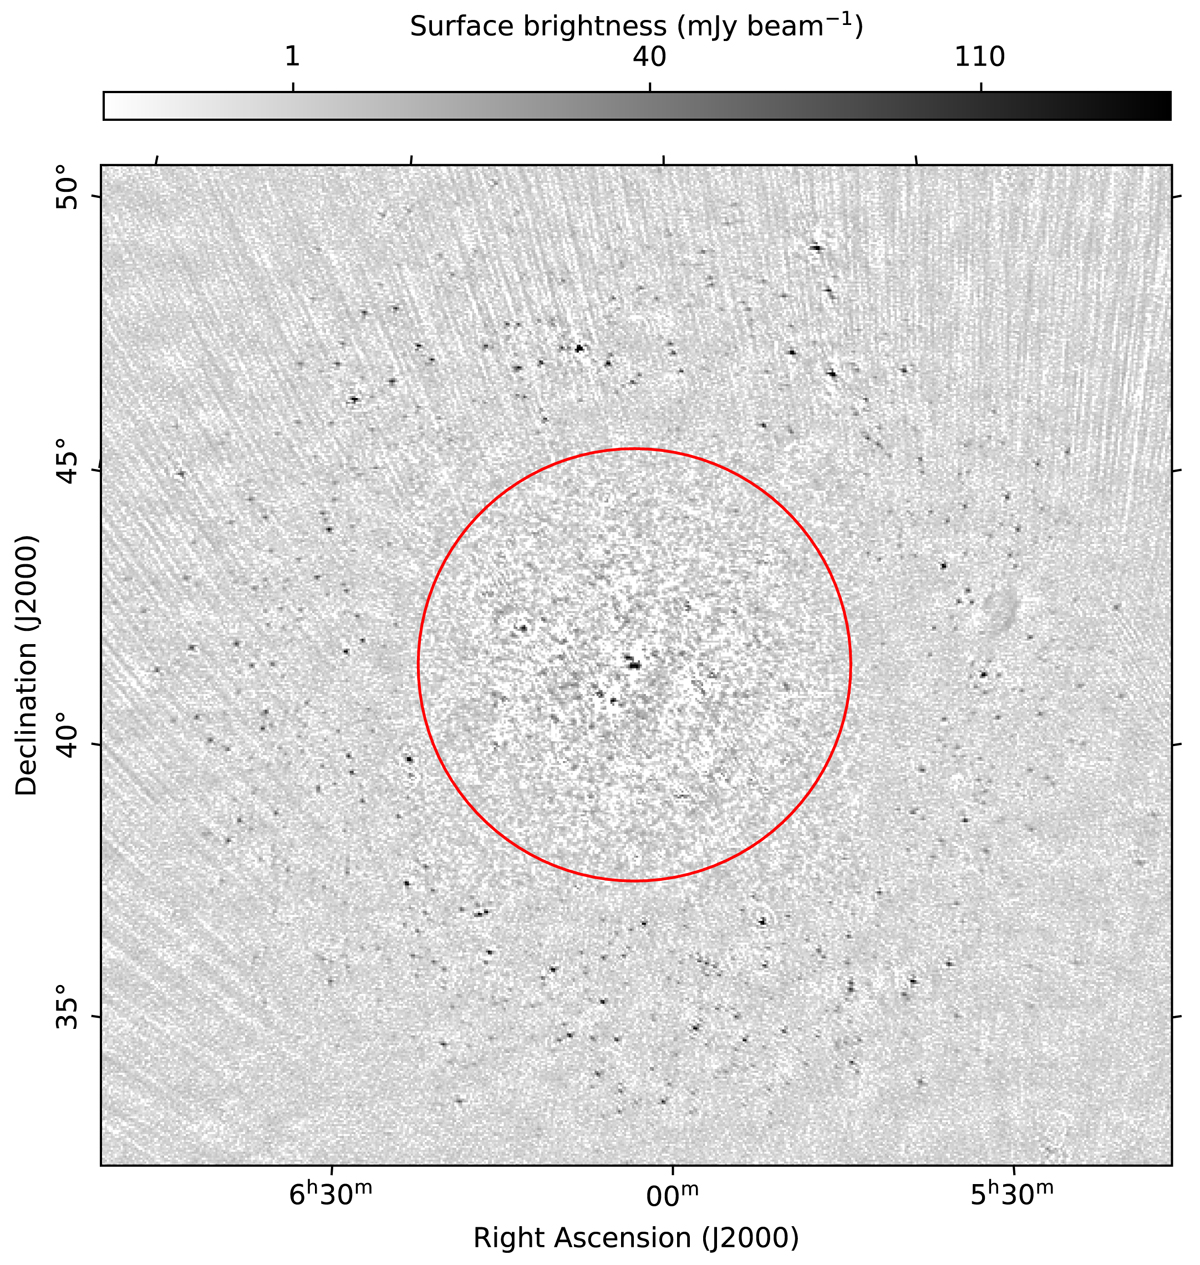
Low-resolution (beam: 209″ × 144″) image of the Toothbrush cluster field after subtraction of mid-resolution sources in the main beam. The only visible sources are those present in the first side-lobe and some extended emission that was not fully subtracted from the high-resolution map. The red circle is an estimation of the first null at mid-frequency (≈2 ⋅ FWHM). Sources outside the circle are subtracted at the end of the first selfcal cycle. Stripes in the background are due to Taurus A, which is at a distance of 22° and which was not demixed.
Current usage metrics show cumulative count of Article Views (full-text article views including HTML views, PDF and ePub downloads, according to the available data) and Abstracts Views on Vision4Press platform.
Data correspond to usage on the plateform after 2015. The current usage metrics is available 48-96 hours after online publication and is updated daily on week days.
Initial download of the metrics may take a while.