Fig. 5.
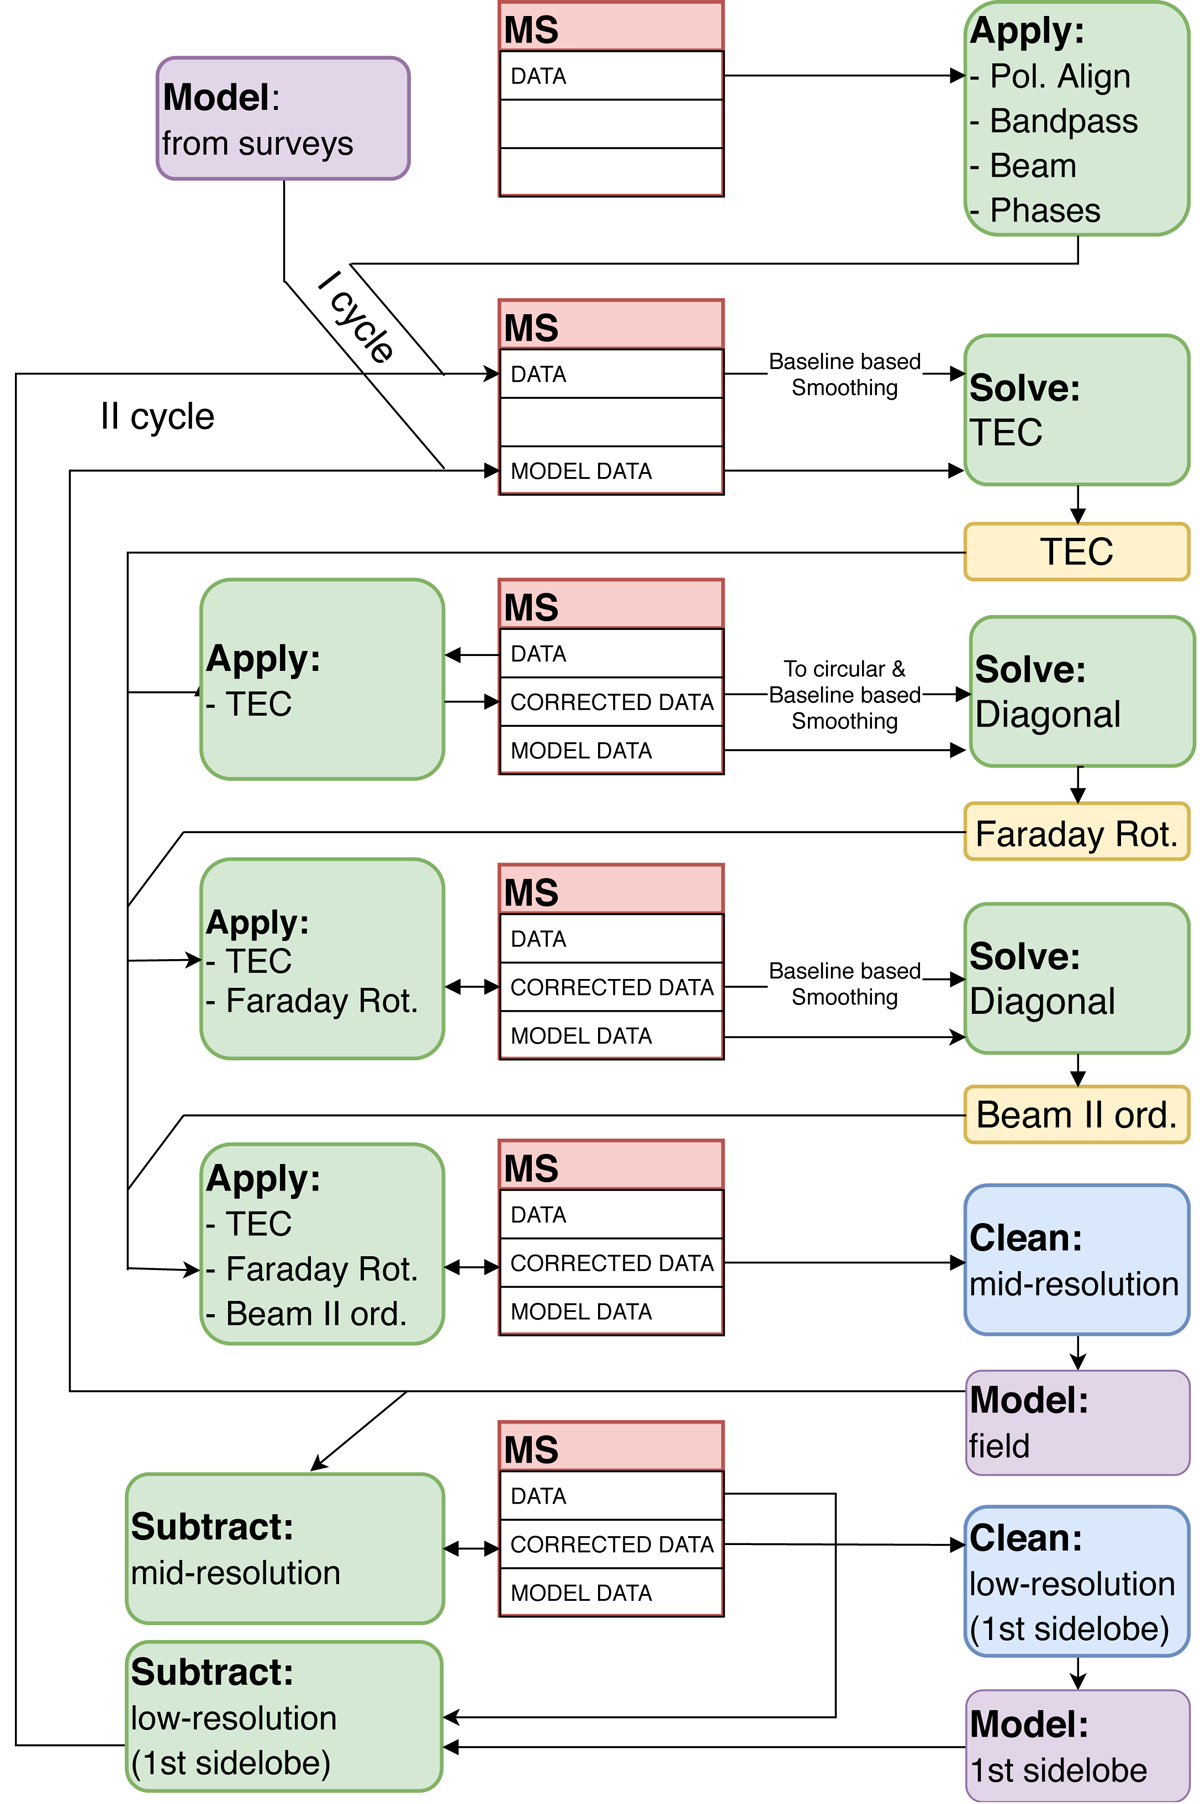
Scheme showing the steps of the self-calibration pipeline. Steps indicated in green are solve, apply, and subtraction steps and are carried out with DPPP (van Diepen et al. 2018). Steps shown in yellow consist of solutions manipulations and are carried out by LoSoTo (de Gasperin et al. 2019). Blue steps represent imaging made with WSClean (Offringa et al. 2014) and purple boxes are source models. Each solve step has an input data column and also uses data from the model. Each apply and subtract step has an input data column and an output data column.
Current usage metrics show cumulative count of Article Views (full-text article views including HTML views, PDF and ePub downloads, according to the available data) and Abstracts Views on Vision4Press platform.
Data correspond to usage on the plateform after 2015. The current usage metrics is available 48-96 hours after online publication and is updated daily on week days.
Initial download of the metrics may take a while.